

The role of chromosomal rearrangements and geographical barriers in the divergence of lineages in a South American subterranean rodent (Rodentia: Ctenomyidae: Ctenomys minutus)
- PMID: 23759727
- PMCID: PMC3807268
- DOI: 10.1038/hdy.2013.49
The role of chromosomal rearrangements and geographical barriers in the divergence of lineages in a South American subterranean rodent (Rodentia: Ctenomyidae: Ctenomys minutus)
Abstract
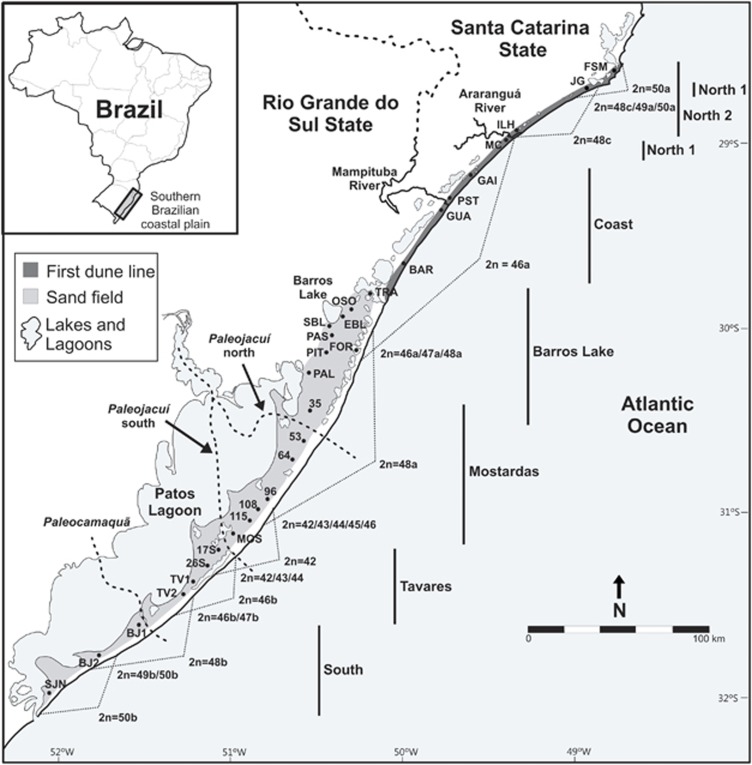
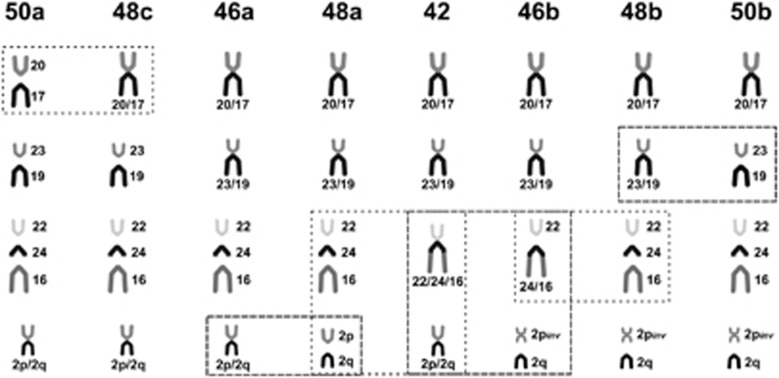
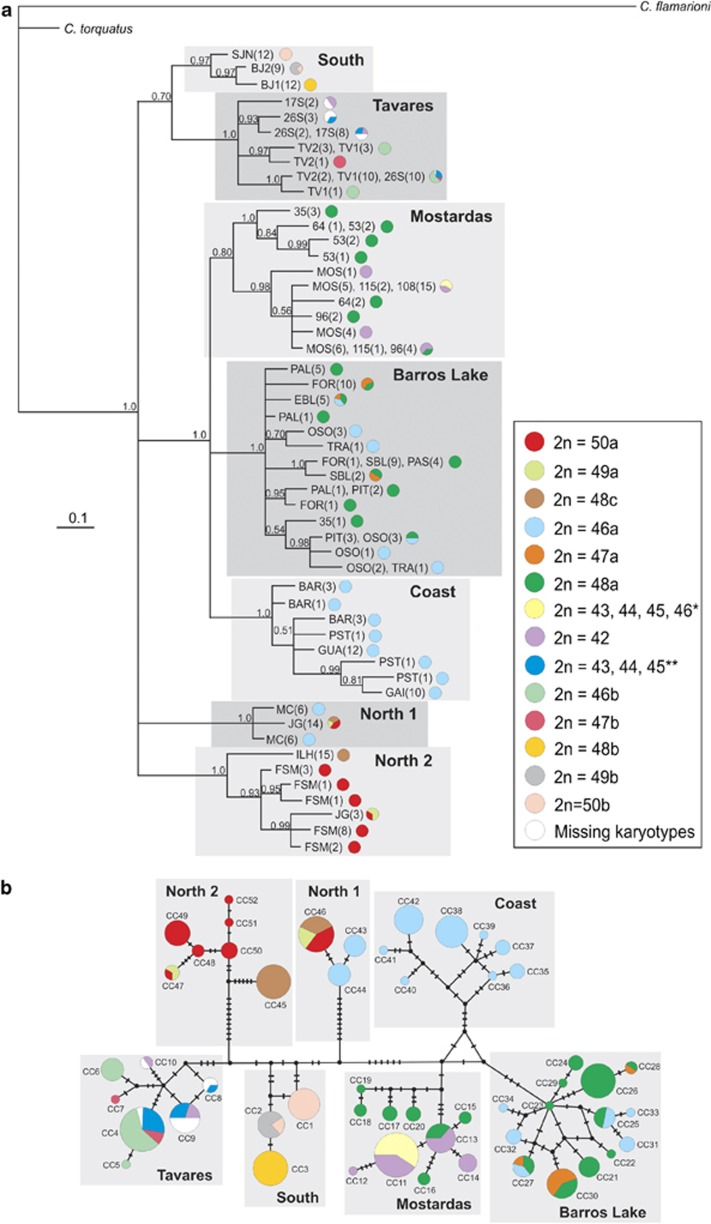
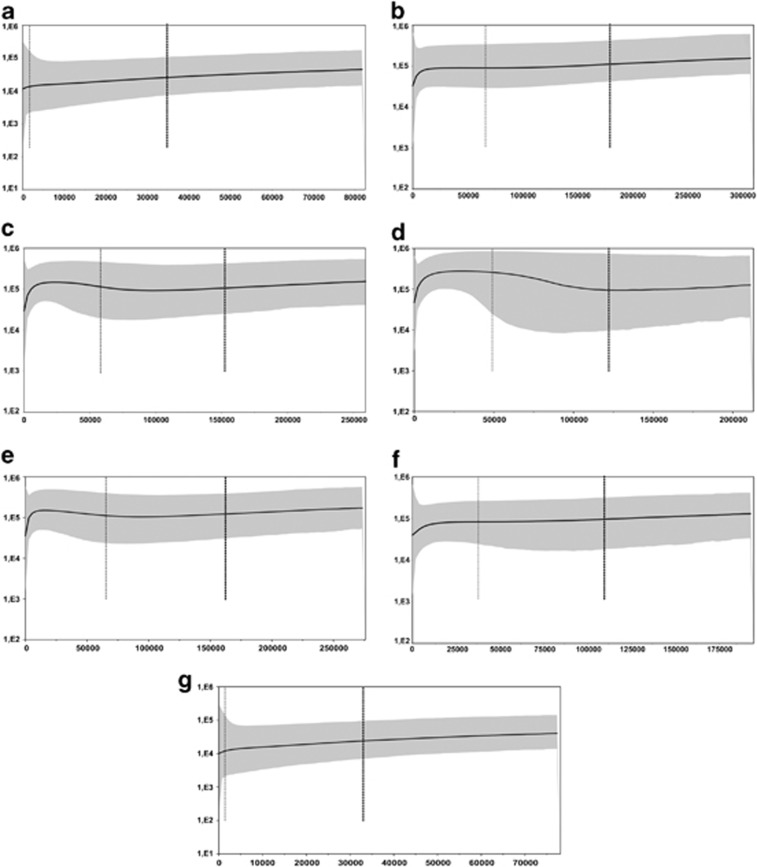
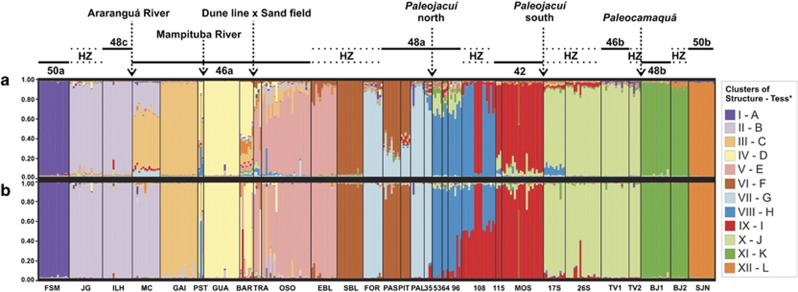
Identifying factors and the extent of their roles in the differentiation of populations is of great importance for understanding the evolutionary process in which a species is involved. Ctenomys minutus is a highly karyotype-polymorphic subterranean rodent, with diploid numbers ranging from 42 to 50 and autosomal arm numbers (ANs) ranging from 68 to 80, comprising a total of 45 karyotypes described so far. This species inhabits the southern Brazilian coastal plain, which has a complex geological history, with several potential geographical barriers acting on different time scales. We assessed the geographical genetic structure of C. minutus, examining 340 individuals over the entire distributional range and using information from chromosomal rearrangements, mitochondrial DNA (mtDNA) sequences and 14 microsatellite loci. The mtDNA results revealed seven main haplogroups, with the most recent common ancestors dating from the Pleistocene, whereas clustering methods defined 12 populations. Some boundaries of mtDNA haplogroups and population clusters can be associated with potential geographical barriers to gene flow. The isolation-by-distance pattern also has an important role in fine-scale genetic differentiation, which is strengthened by the narrowness of the coastal plain and by common features of subterranean rodents (that is, small fragmented populations and low dispersal rates), which limit gene flow among populations. A step-by-step mechanism of chromosomal evolution can be suggested for this species, mainly associated with the metapopulation structure, genetic drift and the geographical features of the southern Brazilian coastal plain. However, chromosomal variations have no or very little role in the diversification of C. minutus populations.
Figures
References
-
- Baitelli R.2012. Evolução Paleogeográfica do Sistema de Paleodrenagem do Rio Jacuí na Planície Costeira do Rio Grande do Sul. PhD thesis, Universidade Federal do Rio Grande do Sul.
-
- Barraclough TG, Vogler AP. Detecting the geographical pattern of speciation from species-level phylogenies. Am Nat. 2000;155:419–434. - PubMed
-
- Busch C, Antinuchi CD, del Valle JC, Kittlein MJ, Malizia AI, Vassallo AI, et al. 2000Population ecology of subterranean rodentsIn: Lacey EA, Patton JL, Cameron GN, (eds)Life Underground: The Biology of Subterranean Rodents The University of Chicago Press: Chicago, IL, USA; 183–226.
-
- Caraballo DA, Abruzzese GA, Rossi MS. Diversity of tuco-tucos (Ctenomys, Rodentia) in the Northeastern wetlands from Argentina: mitochondrial phylogeny and chromosomal evolution. Genetica. 2012;140:125–136. - PubMed
Publication types
MeSH terms
Substances
Associated data
- Actions
- Actions
- Actions
- Actions
- Actions
- Actions
- Actions
- Actions
- Actions
- Actions
- Actions
- Actions
- Actions
- Actions
- Actions
- Actions
- Actions
- Actions
- Actions
- Actions
- Actions
- Actions
- Actions
- Actions
- Actions
- Actions
- Actions
- Actions
- Actions
- Actions
- Actions
- Actions
- Actions
- Actions
- Actions
- Actions
- Actions
- Actions
- Actions
- Actions
- Actions
- Actions
- Actions
- Actions
- Actions
- Actions
- Actions
- Actions
- Actions
- Actions
- Actions
- Actions
- Actions
- Actions
- Actions
- Actions
- Actions
- Actions
- Actions
- Actions
- Actions
- Actions
- Actions
- Actions
- Actions
- Actions
- Actions
- Actions
- Actions
- Actions
- Actions
- Actions
- Actions
- Actions
- Actions
- Actions
- Actions
- Actions
- Actions
LinkOut - more resources
Full Text Sources
Other Literature Sources
