

Genome-wide association mapping to candidate polymorphism resolution in the unsequenced barley genome
- PMID: 21115826
- PMCID: PMC3003063
- DOI: 10.1073/pnas.1010179107
Genome-wide association mapping to candidate polymorphism resolution in the unsequenced barley genome
Abstract
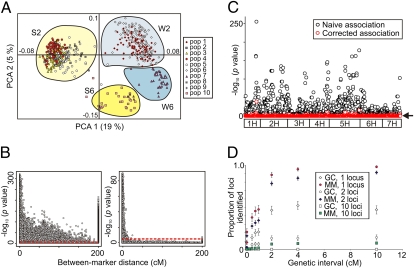
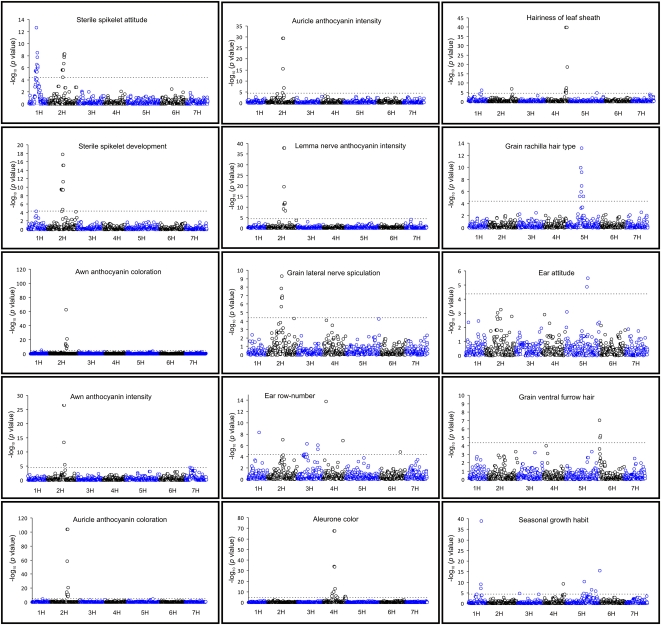
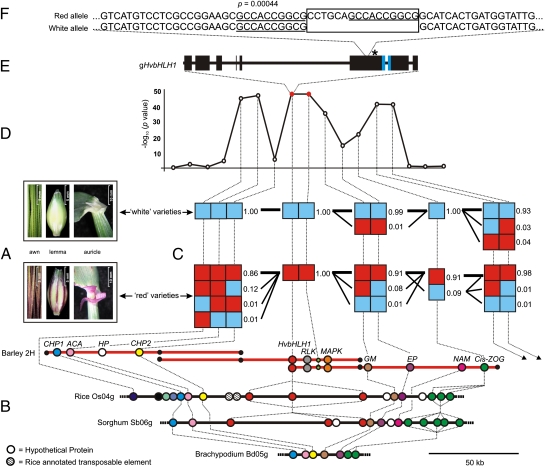
Although commonplace in human disease genetics, genome-wide association (GWA) studies have only relatively recently been applied to plants. Using 32 phenotypes in the inbreeding crop barley, we report GWA mapping of 15 morphological traits across ∼500 cultivars genotyped with 1,536 SNPs. In contrast to the majority of human GWA studies, we observe high levels of linkage disequilibrium within and between chromosomes. Despite this, GWA analysis readily detected common alleles of high penetrance. To investigate the potential of combining GWA mapping with comparative analysis to resolve traits to candidate polymorphism level in unsequenced genomes, we fine-mapped a selected phenotype (anthocyanin pigmentation) within a 140-kb interval containing three genes. Of these, resequencing the putative anthocyanin pathway gene HvbHLH1 identified a deletion resulting in a premature stop codon upstream of the basic helix-loop-helix domain, which was diagnostic for lack of anthocyanin in our association and biparental mapping populations. The methodology described here is transferable to species with limited genomic resources, providing a paradigm for reducing the threshold of map-based cloning in unsequenced crops.
Conflict of interest statement
The authors declare no conflict of interest.
Figures
References
Publication types
MeSH terms
Substances
Associated data
- Actions
- Actions
- Actions
- Actions
- Actions
- Actions
- Actions
- Actions
- Actions
- Actions
- Actions
- Actions
- Actions
- Actions
- Actions
- Actions
- Actions
- Actions
- Actions
- Actions
- Actions
- Actions
- Actions
- Actions
- Actions
- Actions
- Actions
- Actions
- Actions
- Actions
- Actions
- Actions
- Actions
- Actions
- Actions
- Actions
- Actions
- Actions
- Actions
- Actions
- Actions
- Actions
- Actions
- Actions
- Actions
- Actions
- Actions
- Actions
- Actions
- Actions
- Actions
- Actions
- Actions
- Actions
- Actions
- Actions
- Actions
- Actions
- Actions
- Actions
- Actions
- Actions
- Actions
- Actions
- Actions
- Actions
- Actions
- Actions
- Actions
- Actions
- Actions
- Actions
- Actions
- Actions
- Actions
- Actions
- Actions
- Actions
- Actions
- Actions
- Actions
- Actions
- Actions
- Actions
- Actions
- Actions
- Actions
- Actions
- Actions
- Actions
- Actions
Grants and funding
LinkOut - more resources
Full Text Sources
