

Monitoring of 30 marker candidates in early Parkinson disease as progression markers
- PMID: 27164658
- PMCID: PMC4940068
- DOI: 10.1212/WNL.0000000000002651
Monitoring of 30 marker candidates in early Parkinson disease as progression markers
Abstract
Objective: This was a longitudinal single-center cohort study to comprehensively explore multimodal progression markers for Parkinson disease (PD) in patients with recently diagnosed PD (n = 123) and age-matched, neurologically healthy controls (HC; n = 106).
Methods: Thirty tests at baseline and after 24 months covered nonmotor symptoms (NMS), cognitive function, and REM sleep behavior disorder (RBD) by polysomnography (PSG), voxel-based morphometry (VBM) of the brain by MRI, and CSF markers. Linear mixed-effect models were used to estimate differences of rates of change and to provide standardized effect sizes (d) with 95% confidence intervals (CI).
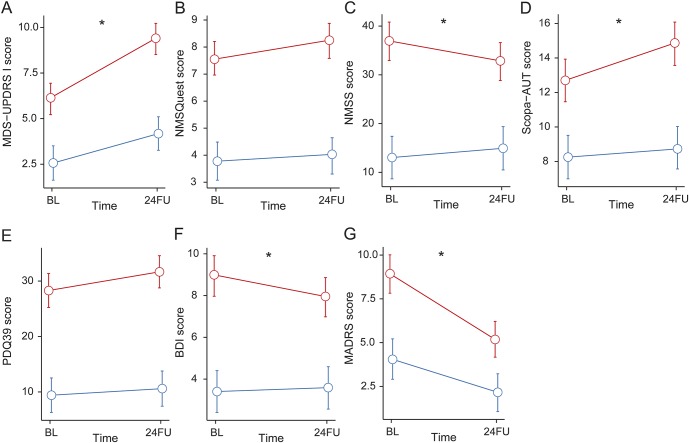
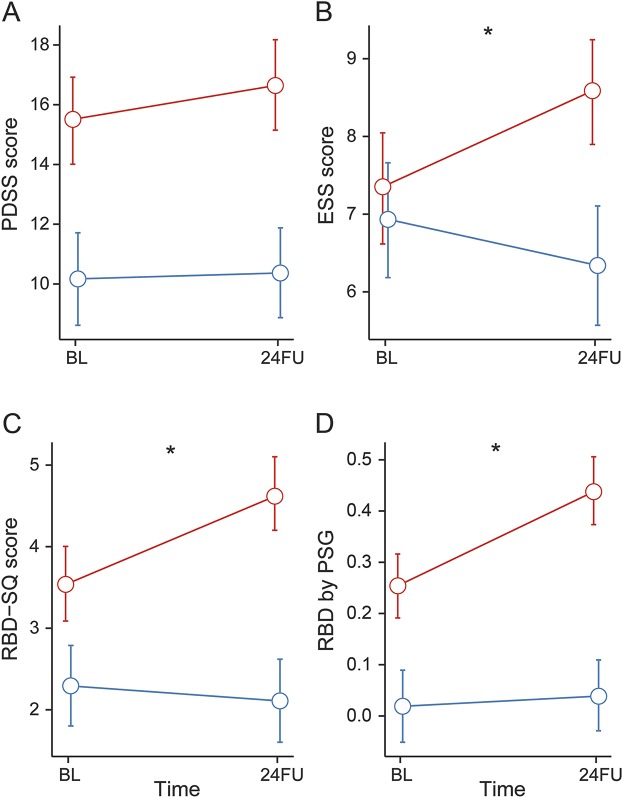
Results: A composite panel of 10 informative markers was identified. Significant relative worsening (PD vs HC) was seen with the following markers: the Unified Parkinson's Disease Rating Scale I (d 0.39; CI 0.09-0.70), the Autonomic Scale for Outcomes in Parkinson's Disease (d 0.25; CI 0.06-0.46), the Epworth Sleepiness Scale (d 0.47; CI 0.24-0.71), the RBD Screening Questionnaire (d 0.44; CI 0.25-0.64), and RBD by PSG (d 0.37; CI 0.19-0.55) as well as VBM units of cortical gray matter (d -0.2; CI -0.3 to -0.09) and hippocampus (d -0.15; CI -0.27 to -0.03). Markers with a relative improvement included the Nonmotor Symptom (Severity) Scale (d -0.19; CI -0.36 to -0.02) and 2 depression scales (Beck Depression Inventory d -0.18; CI -0.36 to 0; Montgomery-Åsberg Depression Rating Scale d -0.26; CI -0.47 to -0.04). Unexpectedly, cognitive measures and select laboratory markers were not significantly changed in PD vs HC participants.
Conclusions: Current CSF biomarkers and cognitive scales do not represent useful progression markers. However, sleep and imaging measures, and to some extent NMS, assessed using adequate scales, may be more informative markers to quantify progression.
© 2016 American Academy of Neurology.
Figures

Comment in
-
Progression and biomarkers for Parkinson disease: Merging motor with nonmotor symptoms.Neurology. 2016 Jul 12;87(2):128-9. doi: 10.1212/WNL.0000000000002664. Epub 2016 May 6. Neurology. 2016. PMID: 27164660 No abstract available.
References
-
- Biglan KM, Holloway RG. Surrogate endpoints in Parkinson's disease research. Curr Neurol Neurosci Rep 2003;3:314–320. - PubMed
-
- Parkinson Study Group. Effects of tocopherol and deprenyl on the progression of disability in early Parkinson's disease. N Engl J Med 1993;328:176–183. - PubMed
-
- Investigators NN-P. A randomized clinical trial of coenzyme Q10 and GPI-1485 in early Parkinson disease. Neurology 2007;68:20–28. - PubMed
-
- Parkinson Study Group PI. Mixed lineage kinase inhibitor CEP-1347 fails to delay disability in early Parkinson disease. Neurology 2007;69:1480–1490. - PubMed
-
- Schuepbach WM, Rau J, Knudsen K, et al. . Neurostimulation for Parkinson's disease with early motor complications. N Engl J Med 2013;368:610–622. - PubMed
Publication types
MeSH terms
Substances
LinkOut - more resources
Full Text Sources
Other Literature Sources
Medical