[Preprint]. 2025 Jul 9:2025.03.31.646438.
doi: 10.1101/2025.03.31.646438.

Epidermal Resident Memory T Cell Fitness Requires Antigen Encounter in the Skin

Affiliations

Epidermal Resident Memory T Cell Fitness Requires Antigen Encounter in the Skin

Eric S Weiss et al. bioRxiv. .

Abstract

CD8+ tissue resident memory T cells (TRM) develop from effectors that seed peripheral tissues where they persist providing defense against subsequent challenges. TRM persistence requires autocrine TGFβ transactivated by integrins expressed on keratinocytes. TRM precursors that encounter antigen in the epidermis during development outcompete bystander TRM for TGFβ resulting in enhanced persistence. ScRNA-seq analysis of epidermal TRM revealed that local antigen experience in the skin resulted in an enhanced differentiation signature in comparison with bystanders. Upon recall, TRM displayed greater proliferation dictated by affinity of antigen experienced during epidermal development. Finally, local antigen experienced TRM differentially expressed TGFβRIII, which increases avidity of the TGFβRI/II receptor complex for TGFβ. Selective ablation of Tgfbr3 reduced local antigen experienced TRM capacity to persist, rendering them phenotypically like bystander TRM. Thus, antigen driven TCR signaling in the epidermis during TRM differentiation results in a lower TGFβ requirement for persistence and increased proliferative capacity that together enhance epidermal TRM fitness.


Conflict of interest statement

Conflict of Interest: D.H.K is a paid consultant for AbbVie Inc, Beiersdorf AG, Janssen Research and Development LLC, and Aditum Bio. DHK has a sponsored research agreement with Galderma Laboratories, Lp. N.A. serves as a consultant or is on the advisory board for : Shennon Biotechnologies, Panther Life Sciences, Verrica pharmaceuticals, Genmab, 23 and me, Johnson and Johnson, Lytix Biopharma. Other authors declare no conflict of interest.

Figures

Figure 1.
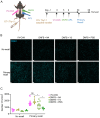
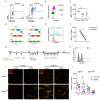
Figure 1.. Epidermal TRM are transcriptionally heterogeneous
(A) Experimental design. Mice were treated with vaccinia virus infection by skin scarification on the left flank on day 0, and then on day 5 post infection the right flank was painted with 0.15% DNFB. On day 56, flanks were harvested for either epidermal whole mount, flow cytometry, or cells were sorted for scRNA-seq. (B) Representative images and (C) quantification of epidermal whole mounts of VV and DNFB treated flanks harvested on day 50 post infection stained for CD8a. (D) Representative flow plots gated on CD45+ CD3+ CD8+ CD90.2+ cells isolated from VV or DNFB treated flanks. (E) Representative flow plots and (F) quantification of B8R tetramer binding of CD103+ TRM gated as in (D) isolated from VV or DNFB treated flanks. (G) The integrated Minimal-Distorted Embedding of all 96 experiments from the ImmgenT consortium with annotated clusters. (H) Minimal-Distorted embedding visualization of transcriptional clusters of skin Trm projected over the ImmgenT dataset. (I) The percentage of cells in each transcriptional cluster found in VV or DNFB treated sites. Each symbol represents paired data from the same individual animal (C, F). Data shown to be nonsignificant by paired Student’s t-tests (C,F). Data are representative of 3 separate experiments. Scale bar in (B) represents 50um.
Figure 2:
Figure 2:. Cutaneous antigen is required for complete TRM differentiation
(A) Signature score analysis of skin T cell clusters calculating the enrichment for previously published T cell state gene sets (N=naïve). Signature score = Mean (average upgenes z-scores) - Mean( average downgenes z-scores). *** p < 0.001 by Dunnett’s multiple comparisons of cluster 3 to all other clusters. (B) Pseudobulk analysis comparing signature scores of cells isolated from VV and DNFB sites as in (A). ** p < 0.01 and *** p < 0.001 by paired Student’s t-tests. (C) Signature score analysis of individual clusters or (D) cells isolated from VV and DNFB sites calculating the enrichment for compared to epidermal TRM isolated at the indicated day post infection. ***p < 0.001 by Dunnett’s multiple comparison test of cluster 3 to all other clusters in (C). * p < 0.05, ** p < 0.01, **** p < 0.0001 by paired Student’s t-tests in (D). Gray line represents a randomized control generated by the average enrichment of each group compared to a randomly generated gene set of an equal number of probes. Datapoints and error bars represent mean and 95% confidence interval of the relative enrichment of each set of DEGs.
Figure 3.
Figure 3.. Local antigen experienced TRM have improved expansion in a recall response
(A) Experimental design. Mice were adoptively transferred with Thy1.1+ OT-I T cells on day -1, then infected with OVA-expressing vaccinia virus by scarification on the left flank on day 0. On day 5 post-infection the right flank was painted with 0.15% DNFB. On day 50, a primary recall response with SIINFEKL peptide in acetone and olive oil was painted on both flanks and harvested on day 56. In some cohorts, mice were allowed to rest for an additional 120 days and then treated with topical SIINFEKL peptide again on day 176 and harvested on day 182. (B) Representative images and (C) quantification of epidermal whole mounts isolated from VV-OVA and DNFB treated flanks stained for anti-Thy1.1 (n=10 animals). (D) Experimental design. Mice were treated as in (A), but for 6 days prior to SIINFEKL treatment they were given either i.p. FTY720, i.p. PBS, i.v. titrated anti-Thy1.1 or i.v. isotype control. (E) Representative epidermal whole mounts images and (F) quantification of skin from VV-OVA treated flanks on day 6 of a primary recall response treated with either FTY720 or PBS. (G) Quantification of total Thy1.1 OT-I cells in epidermal whole mounts on day 6 after a primary recall response in mice treated with either isotype or anti-Thy1.1 depleting antibody. Each symbol represents paired data from an individual same animal (F, G). Data are representative of 3 independent experiments. *p<0.05 by paired Student’s t-tests. Unpaired Student’s t-tests between FTY720 treated (F) or Anti-Thy1.1 treated (G) flanks and PBS treated flanks shows non-signficance for both VV-OVA and DNFB, Scale bar represents 50um (B, F). Each symbol represents the mean +/− SEM (C).
Figure 4.
Figure 4.. Local antigen experienced TRM have increased proliferation during a recall response
(A) Experimental scheme. (B) Representative images of epidermal whole mounts of VV-OVA or DNFB treated flanks on day 2 of a recall response. Arrows highlight cell doublets. (C) Quantification showing percent OT-I cells that are dividing in epidermal whole mounts on day 2 after primary recall response, and (D) total number of dividing OT-I cells. (E) Representative flow cytometric plots and (F) quantification showing BrdU incorporation in gated CD45+ CD8+ CD90.1+ CD103+ CD69+ cells isolates from VV-OVA or DNFB treated flanks. (G) Quantification of total numbers BrdU+ OT-I cells combining OT-I numbers with percentage of BrdU incorporation in (F). (H) Representative histograms and (I) quantification of Annexin V expression in OT-I cells isolated from VV-OVA or DNFB treated flanks or OT-I cells heat-treated at 60°C for 1 hour (HK). Data are representative of 3 separate experiments. *p<0.05, **p<0.01 by Students paired t-tests (C), (D), (F) and (G) or Dunnett’s test (I). Scale bar represents 50um.
Figure 5.
Figure 5.. TRM fitness depends on TCR signal-strength
(A) Experimental scheme. Local antigen experienced and bystander TRM were generated and restimulated as previously described, but on the DNFB-treated flanks, altered peptide ligand variants of SIINFEKL were topically applied to the skin 1 day after recruitment to the skin. (B) Representative images and (C) quantification of epidermal whole mounts (CD90.1 cyan) of VV-OVA and DNFB+ APL treated flanks, at steady state (no recall) or 6 days post recall response. Each symbol represents data from an individual animal. Data are representative of 5 independent experiments. *p<0.05 by unpaired Student’s t-tests. Scale bar, 50um.
Figure 6.
Figure 6.. Local antigen experienced TRM have improved persistence mediated by TGFßRIII
(A) Representative flow cytometric plots of TGFßRIII staining of Thy1.1+ OT-I cells stimulated in vitro for 48 hours with PBS or anti-CD3 anti-CD28. (B) Representative histograms showing TGFßRIII expressing in CD45+ CD3+ CD8+ CD90.1+ gated OT-I cells isolated from VV-OVA, DNFB or untreated flanks at least 50 days post infection. (C) Quantification of (B). (D) Schematic demonstrating genetics of Tgfbr3WT and Tgfbr3ΔCD8 mice. (E) Representative histogram and (F) quantification of TGFßRIII expression in huNGFR or huNGFR+ Tgfbr3ΔCD8 T cells harvested 5 days following i.p. treatment with tamoxifen then stimulated in vitro for 48 hours with anti-CD3 and anti-CD28. (G) Experimental scheme. (H) Representative histogram of CD45.2+CD3+CD8+CD90.1+ OT-I cells isolated from LNs after tamoxifen treatment demonstrating transformation efficiency. (I) Representative epidermal whole mounts showing Thy1.1 staining (green), huNGFR staining (red) or merge (yellow) of VV-OVA or DNFB treated flanks from mice adoptively transferred with either Tgfbr3WT or Tgfbr3ΔCD8 cells, treated with tamoxifen i.p., and then given either PBS or i.p. CWHM12 for 10 days. Hair follicles in the sample present as long yellow streaks. (J) Quantification of total huNGFR+ Thy1.1+ OT-I in (I). Each symbol represents data from an individual animal. Black lines represent group means. Data is representative of 3 independent experiments. *p<0.05 by Dunnett’s test (C) or paired Student’s t-tests (F) and (J). Unpaired Student’s t-tests between Tgfbr3WT and Tgfbr3ΔCD8 vehicle treated groups show non-significance for both VV-OVA and DNFB treated flanks. Scale bar represents 50um.

References

    1. Jiang X., et al. , Skin infection generates non-migratory memory CD8+ T(RM) cells providing global skin immunity. Nature, 2012. 483(7388): p. 227–31. - PMC - PubMed
    1. Peng T., et al. , Tissue-Resident-Memory CD8(+) T Cells Bridge Innate Immune Responses in Neighboring Epithelial Cells to Control Human Genital Herpes. Front Immunol, 2021. 12: p. 735643. - PMC - PubMed
    1. Oguejiofor K., et al. , Stromal infiltration of CD8 T cells is associated with improved clinical outcome in HPV-positive oropharyngeal squamous carcinoma. Br J Cancer, 2015. 113(6): p. 886–93. - PMC - PubMed
    1. Virassamy B., et al. , Intratumoral CD8(+) T cells with a tissue-resident memory phenotype mediate local immunity and immune checkpoint responses in breast cancer. Cancer Cell, 2023. 41(3): p. 585–601.e8. - PubMed
    1. Strobl J., et al. , Long-term skin-resident memory T cells proliferate in situ and are involved in human graft-versus-host disease. Sci Transl Med, 2020. 12(570).

Publication types