

Species-specific responses of Late Quaternary megafauna to climate and humans
- PMID: 22048313
- PMCID: PMC4070744
- DOI: 10.1038/nature10574
Species-specific responses of Late Quaternary megafauna to climate and humans
Abstract
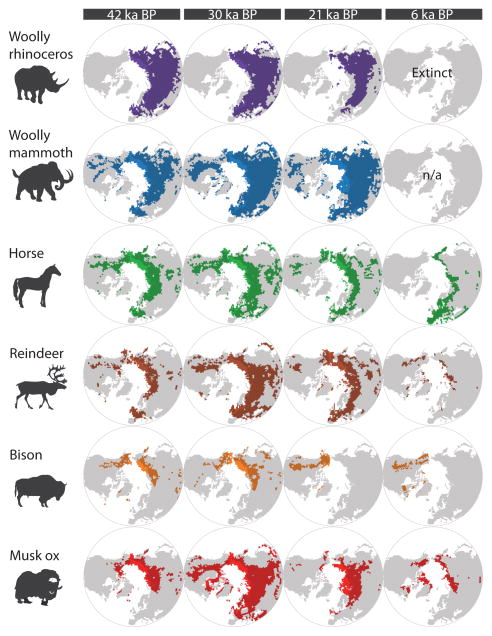
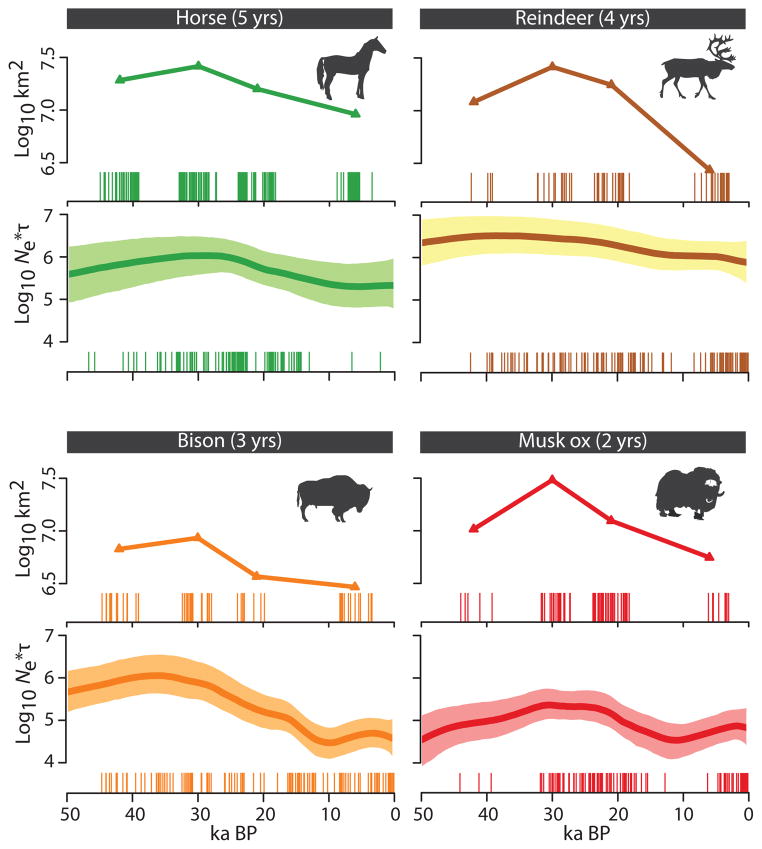
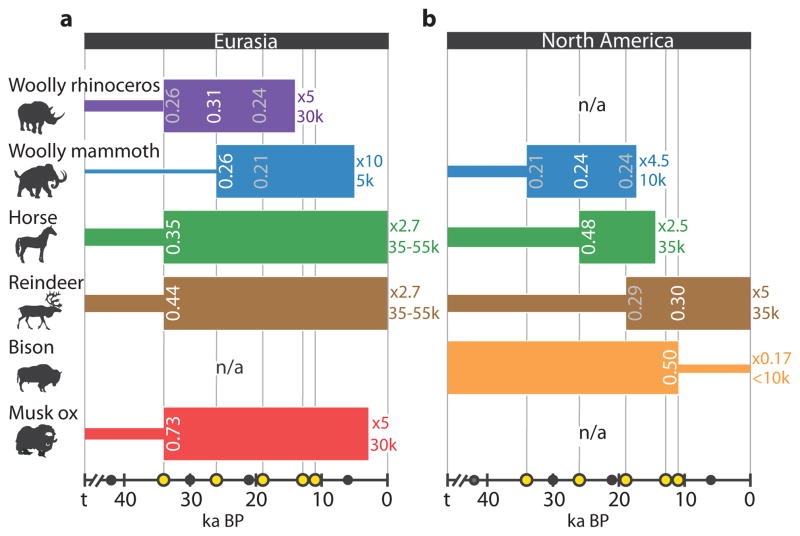
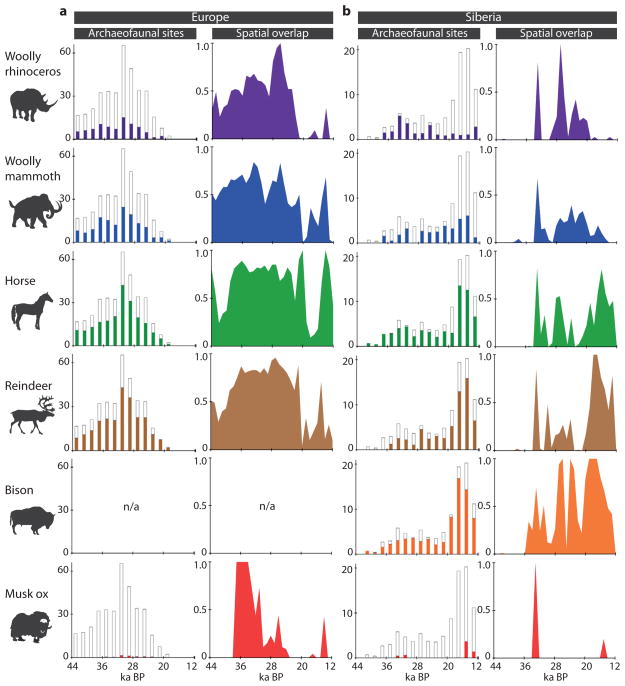
Despite decades of research, the roles of climate and humans in driving the dramatic extinctions of large-bodied mammals during the Late Quaternary period remain contentious. Here we use ancient DNA, species distribution models and the human fossil record to elucidate how climate and humans shaped the demographic history of woolly rhinoceros, woolly mammoth, wild horse, reindeer, bison and musk ox. We show that climate has been a major driver of population change over the past 50,000 years. However, each species responds differently to the effects of climatic shifts, habitat redistribution and human encroachment. Although climate change alone can explain the extinction of some species, such as Eurasian musk ox and woolly rhinoceros, a combination of climatic and anthropogenic effects appears to be responsible for the extinction of others, including Eurasian steppe bison and wild horse. We find no genetic signature or any distinctive range dynamics distinguishing extinct from surviving species, emphasizing the challenges associated with predicting future responses of extant mammals to climate and human-mediated habitat change.
© 2011 Macmillan Publishers Limited. All rights reserved
Figures
References
-
- Barnosky AD, Koch PL, Feranec RS, Wing SL, Shabel AB. Assessing the causes of late Pleistocene extinctions on the continents. Science. 2004;306:70–75. - PubMed
-
- Martin PS. In: Quaternary Extinctions: A Prehistoric Revolution. Martin PS, Klein RG, editors. Univ. Arizona Press; Tucson: 1984. pp. 364–403.
-
- Alroy JA. multispecies overkill simulation of the end-Pleistocene megafaunal mass extinction. Science. 2001;292:1893–1896. - PubMed
-
- Stuart AJ, Kosintsev PA, Higham TFG, Lister AM. Pleistocene to Holocene extinction dynamics in giant deer and woolly mammoth. Nature. 2004;431:684–689. - PubMed
-
- Koch PL, Barnosky AD. Late Quaternary extinctions: state of the debate. Ann Rev Ecol Evol Syst. 2006;37:215–250.
Publication types
MeSH terms
Substances
Associated data
- Actions
- Actions
- Actions
- Actions
- Actions
- Actions
- Actions
- Actions
- Actions
- Actions
- Actions
- Actions
- Actions
- Actions
- Actions
- Actions
- Actions
- Actions
- Actions
- Actions
- Actions
- Actions
- Actions
- Actions
- Actions
- Actions
- Actions
- Actions
- Actions
- Actions
- Actions
- Actions
- Actions
- Actions
- Actions
- Actions
- Actions
- Actions
- Actions
- Actions
- Actions
- Actions
- Actions
- Actions
- Actions
- Actions
- Actions
- Actions
- Actions
- Actions
- Actions
- Actions
- Actions
- Actions
- Actions
- Actions
- Actions
- Actions
- Actions
- Actions
- Actions
- Actions
- Actions
- Actions
- Actions
- Actions
- Actions
- Actions
- Actions
- Actions
- Actions
- Actions
- Actions
- Actions
- Actions
- Actions
- Actions
- Actions
- Actions
- Actions
- Actions
- Actions
- Actions
- Actions
- Actions
- Actions
- Actions
- Actions
- Actions
- Actions
- Actions
- Actions
- Actions
- Actions
- Actions
- Actions
- Actions
- Actions
- Actions
- Actions
- Actions
- Actions
- Actions
- Actions
- Actions
- Actions
- Actions
- Actions
- Actions
- Actions
- Actions
- Actions
- Actions
- Actions
- Actions
- Actions
- Actions
- Actions
- Actions
- Actions
- Actions
- Actions
- Actions
- Actions
- Actions
- Actions
- Actions
- Actions
- Actions
- Actions
- Actions
- Actions
- Actions
- Actions
- Actions
- Actions
- Actions
- Actions
- Actions
- Actions
- Actions
- Actions
- Actions
- Actions
- Actions
- Actions
- Actions
- Actions
- Actions
- Actions
- Actions
- Actions
- Actions
- Actions
- Actions
- Actions
- Actions
- Actions
- Actions
- Actions
- Actions
- Actions
- Actions
- Actions
- Actions
- Actions
- Actions
- Actions
- Actions
- Actions
- Actions
- Actions
- Actions
- Actions
- Actions
- Actions
- Actions
- Actions
- Actions
- Actions
- Actions
- Actions
- Actions
- Actions
- Actions
- Actions
- Actions
- Actions
- Actions
- Actions
- Actions
- Actions
- Actions
- Actions
- Actions
- Actions
- Actions
- Actions
- Actions
- Actions
- Actions
- Actions
- Actions
- Actions
- Actions
- Actions
- Actions
- Actions
- Actions
- Actions
- Actions
- Actions
- Actions
- Actions
- Actions
- Actions
- Actions
- Actions
- Actions
- Actions
- Actions
- Actions
- Actions
- Actions
- Actions
- Actions
- Actions
- Actions
- Actions
- Actions
- Actions
- Actions
- Actions
- Actions
- Actions
- Actions
- Actions
- Actions
- Actions
- Actions
- Actions
- Actions
- Actions
- Actions
- Actions
- Actions
- Actions
- Actions
- Actions
- Actions
- Actions
- Actions
- Actions
- Actions
- Actions
- Actions
- Actions
- Actions
- Actions
- Actions
- Actions
- Actions
- Actions
- Actions
- Actions
- Actions
- Actions
- Actions
- Actions
- Actions
- Actions
- Actions
- Actions
- Actions
Grants and funding
LinkOut - more resources
Full Text Sources
Medical
Miscellaneous
