. 2014 Oct 24;9(10):e111017.
doi: 10.1371/journal.pone.0111017. eCollection 2014.

Dengue virus 1 in Buenos Aires from 1999 to 2010: towards local spread

Affiliations

Dengue virus 1 in Buenos Aires from 1999 to 2010: towards local spread

Estefanía Tittarelli et al. PLoS One. .

Abstract

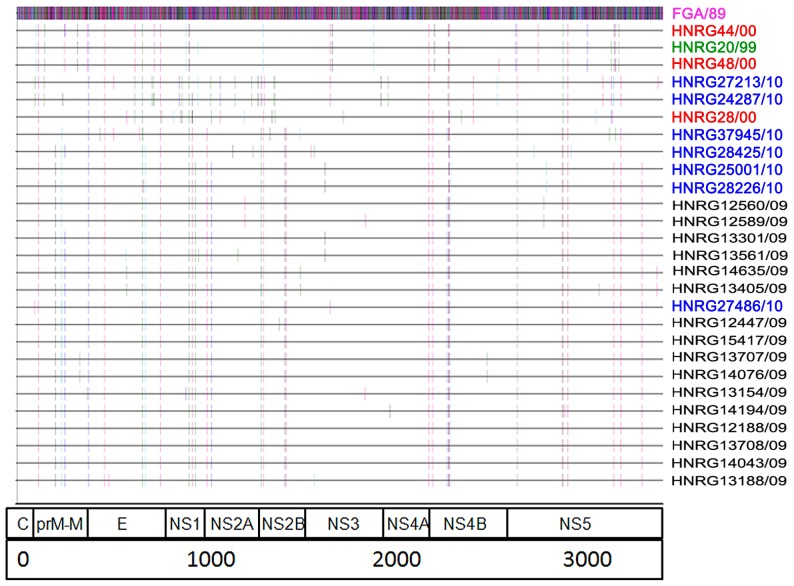
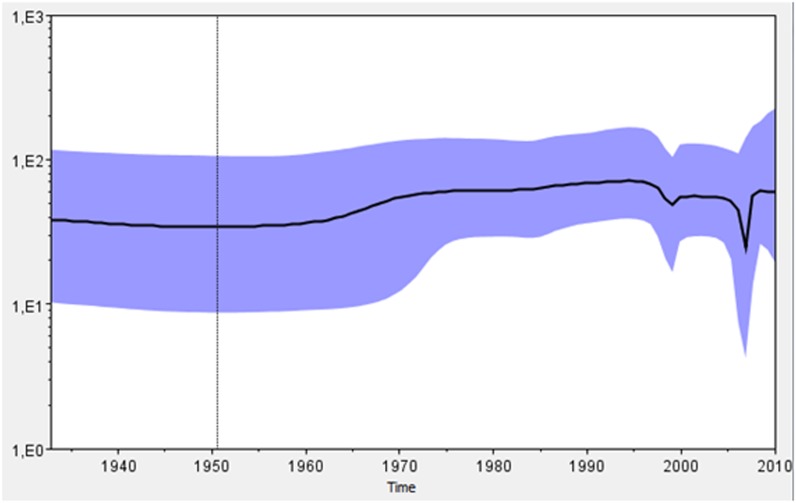
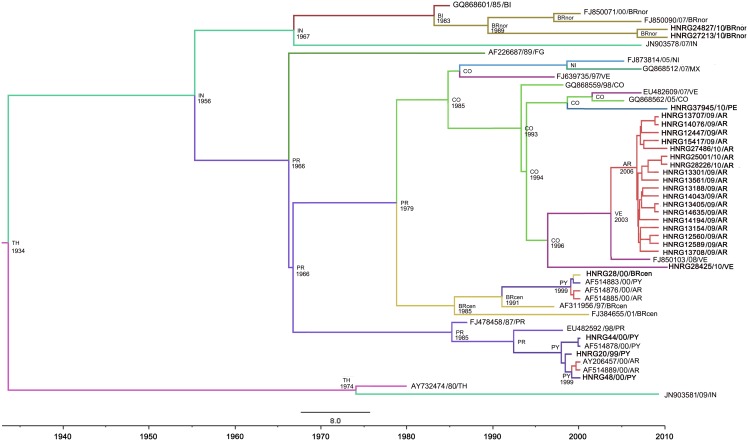
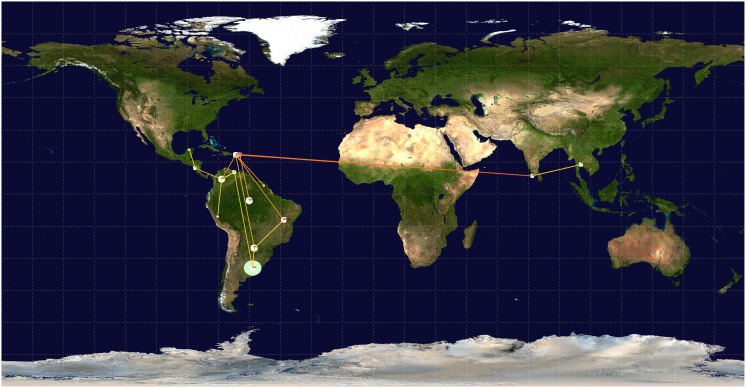
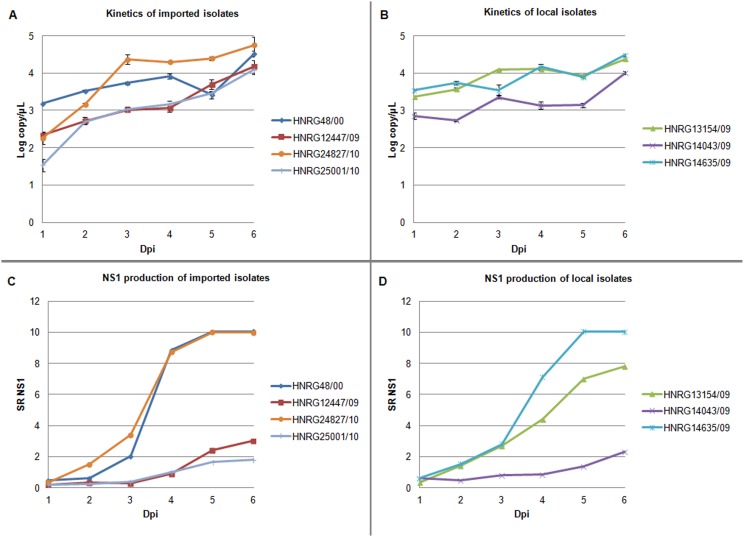
Dengue virus (DENV) is a public health problem representing the most important arthropod-borne viral disease in humans. In Argentina, Northern provinces have reported autochthonous cases since 1997, though these outbreaks have originated in bordering countries, where co-circulation of more than one serotype has been reported. In the last decade, imported dengue cases have been reported in Buenos Aires, the urban area of Argentina with the highest population density. In 2009, a dengue outbreak affected Buenos Aires and, for the first time, local transmission was detected. All cases of this outbreak were caused by DENV-1. In this report, we present the full-length sequences of 27 DENV-1 isolates, corresponding to imported cases of 1999-2000, as well as local and imported cases of the 2009 and 2010 outbreaks. We analyzed their phylogenetic and phylodynamic relationships and their global and local spread. Additionally, we characterized their genomic and phenotypic features. All cases belonged to DENV-1 genotype V. The most recent ancestor for this genotype was dated ∼1934, whereas that for the 2009 outbreak was dated ∼2007. The mean rates of nucleotide substitution were 4.98E-4 and 8.53E-4 subs./site/yr, respectively. We inferred an introduction from Paraguay in 1999-2000 and mainly from Venezuela during 2009-2010. Overall, the number of synonymous substitutions per synonymous site significantly exceeded the number of non-synonymous substitutions per site and 12 positively selected sites were detected. These analyses could contribute to a better understanding regarding spread and evolution of this pathogen in the Southern Cone of South America.


Conflict of interest statement

Competing Interests: The authors have declared that no competing interests exist.

Figures

Figure 1
Figure 1. Location of non-synonymous changes in the polyprotein of DENV-1 strains in relation to the reference sequence FGA/89.
Polar and non-polar amino acids are coded as follows: hydrophobic in pink (Ala, Phe, Ile, Leu, Met, Pro, Val, Trp); polar but uncharged in light blue (Cys, Gly, Asn, Gln, Ser, Thr, Tyr); negatively charged in gray (Asp, Glu); and positively charged in red (His, Lys, Arg).
Figure 2
Figure 2. Bayesian skyline plot for DENV-1 genotype V.
The population size of DENV-1 genotype V (Y axis) vs time in years (X axis) is shown. Ninety-percent highest probability densities are considered.
Figure 3
Figure 3. Most clade credibility tree obtained by a discrete phylogeographic analysis of DENV-1 genotype V.
The probable country location and age of the ancestors are shown on the nodes (5E+8 generations sampling every 5E+4). Sequences included in the analysis are noted as GenBank accession number/collection date/source country for sequences downloaded from GenBank, and as HNRGnumber/collection date/source country for sequences obtained in our laboratory. Abbreviations of the countries are as follows: AR: Argentina, BI: British Virgin Islands, BRcen: Center of Brazil, BRnor: North of Brazil, CO: Colombia, FG: French Guiana, IN: India, MX: Mexico, NI: Nicaragua, PE: Peru, PR: Puerto Rico (USA), PY: Paraguay, TH: Thailand, VE: Venezuela.
Figure 4
Figure 4. Inferred spread obtained by a discrete phylogeographic analysis of DENV-1 genotype V.
The KML file for visualization in Google Earth is available as a supplementary dataset (Video S1).
Figure 5
Figure 5. Viral RNA copies and NS1 production.
Biological properties of imported (A and C) and local isolates (B and D). Viral loads are expressed as log copy/µL (A and B), points are mean values of two independent experiments. The SD are not seen in some of the points because they fall inside the symbol. NS1 production is expressed as absorbance at 450 nm/cut-off value (SR = sample ratio) (C and D). Dpi: days post-infection.

References

    1. Martina BEE, Koraka P, Osterhaus ADME (2009) Dengue Virus Pathogenesis: an Integrated View. Clin Microbiol Rev 22: 564–581 10.1128/CMR.00035-09 - DOI - PMC - PubMed
    1. Bhatt S, Gething PW, Brady OJ, Messina JP, Farlow AW, et al. (2013) The global distribution and burden of dengue. Nature 496: 504–507 10.1038/nature12060 - DOI - PMC - PubMed
    1. Roca Y, Baronti C, Revollo RJ, Cook S, Loayza R, et al. (2009) Molecular epidemiological analysis of dengue fever in Bolivia from 1998 to 2008. Vector Borne Zoonotic Dis Larchmt N 9: 337–344 10.1089/vbz.2008.0187 - DOI - PMC - PubMed
    1. Dick OB, Martín JLS, Montoya RH, Diego J del, Zambrano B, et al. (2012) The History of Dengue Outbreaks in the Americas. Am J Trop Med Hyg 87: 584–593 10.4269/ajtmh.2012.11-0770 - DOI - PMC - PubMed
    1. Seijo A, Cernigoi B, Deodato B (2001) [Dengue imported from Paraguay to Buenos Aires. Clinical and epidemiological report of 38 cases]. Medicina (Mex) 61: 137–141. - PubMed

Publication types