. 2014 Mar;88(5):2891-902.
doi: 10.1128/JVI.03014-13. Epub 2013 Dec 26.

Identifying recombination hot spots in the HIV-1 genome

Affiliations

Identifying recombination hot spots in the HIV-1 genome

Redmond P Smyth et al. J Virol. 2014 Mar.

Abstract

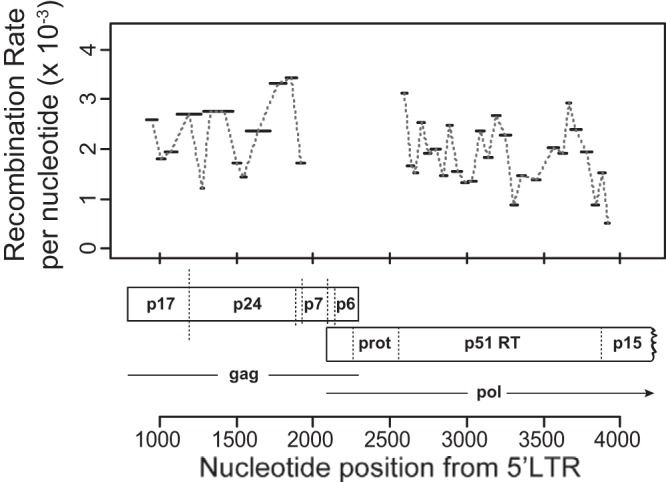
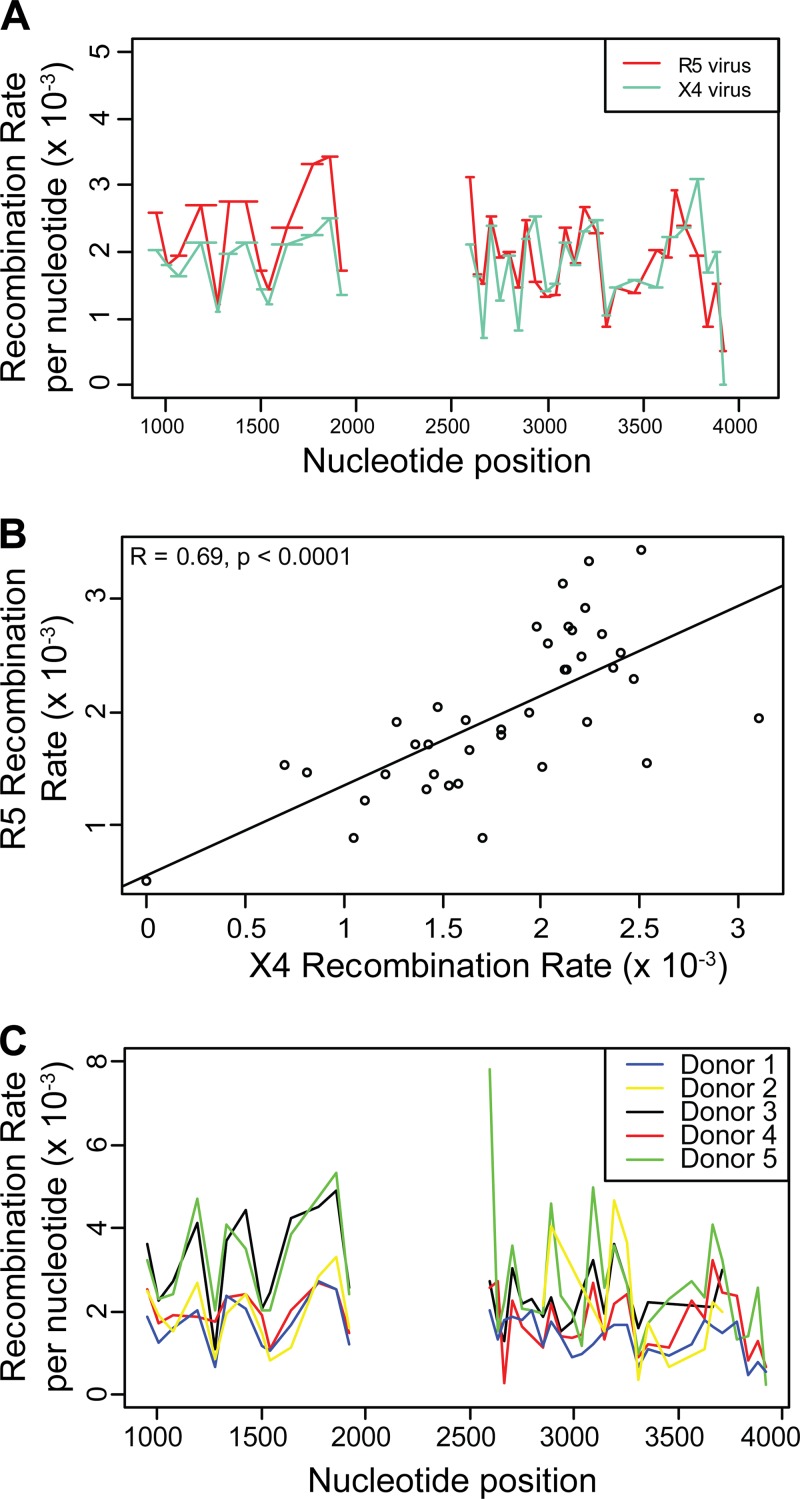
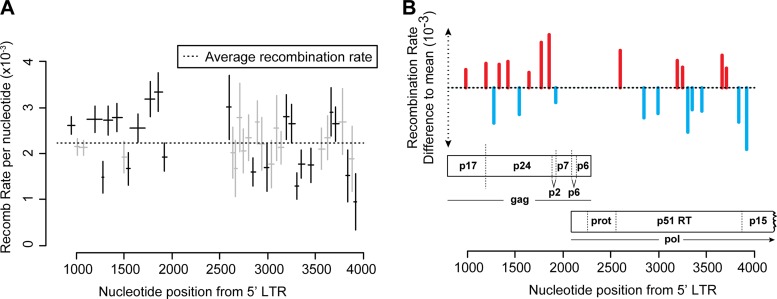
HIV-1 infection is characterized by the rapid generation of genetic diversity that facilitates viral escape from immune selection and antiretroviral therapy. Despite recombination's crucial role in viral diversity and evolution, little is known about the genomic factors that influence recombination between highly similar genomes. In this study, we use a minimally modified full-length HIV-1 genome and high-throughput sequence analysis to study recombination in gag and pol in T cells. We find that recombination is favored at a number of recombination hot spots, where recombination occurs six times more frequently than at corresponding cold spots. Interestingly, these hot spots occur near important features of the HIV-1 genome but do not occur at sites immediately around protease inhibitor or reverse transcriptase inhibitor drug resistance mutations. We show that the recombination hot and cold spots are consistent across five blood donors and are independent of coreceptor-mediated entry. Finally, we check common experimental confounders and find that these are not driving the location of recombination hot spots. This is the first study to identify the location of recombination hot spots between two similar viral genomes with great statistical power and under conditions that closely reflect natural recombination events among HIV-1 quasispecies.

Importance: The ability of HIV-1 to evade the immune system and antiretroviral therapy depends on genetic diversity within the viral quasispecies. Retroviral recombination is an important mechanism that helps to generate and maintain this genetic diversity, but little is known about how recombination rates vary within the HIV-1 genome. We measured recombination rates in gag and pol and identified recombination hot and cold spots, demonstrating that recombination is not random but depends on the underlying gene sequence. The strength and location of these recombination hot and cold spots can be used to improve models of viral dynamics and evolution, which will be useful for the design of robust antiretroviral therapies.


Figures

FIG 1
FIG 1
Recombination rate variation in gag and pol. Recombination rates were measured in 39 genome regions ranging from 21 nt to 159 nt in length (denoted by horizontal bars) in gag and pol. The average number of recombination events per nucleotide per round of infection (REPN) is shown on the y axis, with nucleotide position relative to the beginning of the NL43 5′ long terminal repeat (LTR) shown on the x axis.
FIG 2
FIG 2
Recombination rate hot spots are consistent between viral phenotypes and PBMC blood donors. (A, C) Recombination rates are compared between two viral phenotypes, R5 and X4, and between 5 blood donors, with the average number of recombination events per nucleotide per round of infection (REPN) shown on the y axis and nucleotide position relative to the beginning of the NL43 5′ LTR shown on the x axis. (B) Correlation between the recombination rates of two viruses differing in viral phenotype, with REPN shown on both axes.
FIG 3
FIG 3
Schematic of marker configurations and how to compare between them. (A) In this study, recombination is measured between wild-type virus and a marker system with silent codon modification markers that do not affect any viral proteins or packaging (marker configuration MKhigh). To test that these codon modifications do not influence our recombination rate measurements, a second marker system virus is created where the codon modifications occur at different nucleotide positions (marker configuration MKlow). (B) To compare between marker configurations, MKhigh is used to predict what would be measured as the recombination rate if MKlow was used. This prediction can then be directly compared to the experimental results for MKlow. For each interval in MKlow, the MKhigh prediction is calculated by averaging the overlapping MKhigh interval's recombination rate and weighting this average by the proportion of overlap.
FIG 4
FIG 4
Recombination hot spots are not a product of marker design. To check if recombination rate hot spots are driven by the choice of silent codon modifications, we measured the recombination rate in two different marker configurations, MKhigh and MKlow, for CCR5(R5)-tropic viruses (A) and CXCR4(X4)-tropic virus (C) and performed viral replicates of identical viruses (E). (A, C, D) Recombination rates, with the average number of recombination events per nucleotide per round of infection (REPN) shown on the y axis and nucleotide position relative to the beginning of the NL43 5′ LTR shown on the x axis. (B, D) Correlations between the recombination rates of MKhigh and MKlow viruses, with REPN shown on both axes. (F) Correlation between the recombination rates of MKhigh replicate infections with REPN shown on both axes. Correlations are Pearson product moment correlations.
FIG 5
FIG 5
Ninety-five-percent confidence intervals for the recombination rate in each region for the R5 phenotype. We fit a generalized linear model to the data set to calculate the statistical significance of recombination hot and cold spots, after accounting for confounding factors such as viral phenotype and donor. The model estimates the standard error in recombination rate for each genome region, from which a 95% confidence interval is obtained. Those intervals that do not overlap the average rate are bolded. (A) Recombination rate per nucleotide for each genome segment in R5 averaged over all donors. Horizontal bars represent the length of the genome region. Ninety-five-percent confidence intervals are Bonferroni corrected for multiple comparisons. (B) Statistically significant hot and cold spots corresponding to genome location.

References

    1. Abram ME, Ferris AL, Shao W, Alvord WG, Hughes SH. 2010. Nature, position, and frequency of mutations made in a single cycle of HIV-1 replication. J. Virol. 84:9864–9878. 10.1128/JVI.00915-10 - DOI - PMC - PubMed
    1. Mansky LM, Temin HM. 1995. Lower in vivo mutation rate of human immunodeficiency virus type 1 than that predicted from the fidelity of purified reverse transcriptase. J. Virol. 69:5087–5094 - PMC - PubMed
    1. Mansky LM. 1996. Forward mutation rate of human immunodeficiency virus type 1 in a T lymphoid cell line. AIDS Res. Hum. Retroviruses 12:307–314. 10.1089/aid.1996.12.307 - DOI - PubMed
    1. Smyth RP, Davenport MP, Mak J. 2012. The origin of genetic diversity in HIV-1. Virus Res. 169:415–429. 10.1016/j.virusres.2012.06.015 - DOI - PubMed
    1. Hu WS, Temin HM. 1990. Genetic consequences of packaging two RNA genomes in one retroviral particle: pseudodiploidy and high rate of genetic recombination. Proc. Natl. Acad. Sci. U. S. A. 87:1556–1560. 10.1073/pnas.87.4.1556 - DOI - PMC - PubMed

MeSH terms

Substances

Associated data

LinkOut - more resources