. 2014 Apr 11:5:3650.
doi: 10.1038/ncomms4650.

Protein interaction network of alternatively spliced isoforms from brain links genetic risk factors for autism

Affiliations

Protein interaction network of alternatively spliced isoforms from brain links genetic risk factors for autism

Roser Corominas et al. Nat Commun. .

Erratum in

Abstract

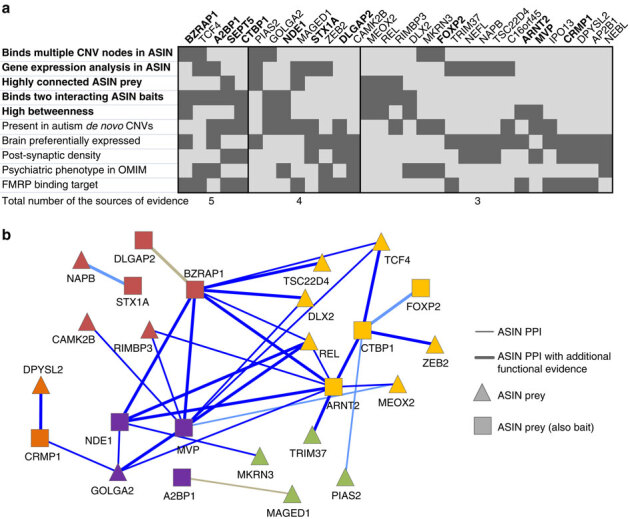
Increased risk for autism spectrum disorders (ASD) is attributed to hundreds of genetic loci. The convergence of ASD variants have been investigated using various approaches, including protein interactions extracted from the published literature. However, these datasets are frequently incomplete, carry biases and are limited to interactions of a single splicing isoform, which may not be expressed in the disease-relevant tissue. Here we introduce a new interactome mapping approach by experimentally identifying interactions between brain-expressed alternatively spliced variants of ASD risk factors. The Autism Spliceform Interaction Network reveals that almost half of the detected interactions and about 30% of the newly identified interacting partners represent contribution from splicing variants, emphasizing the importance of isoform networks. Isoform interactions greatly contribute to establishing direct physical connections between proteins from the de novo autism CNVs. Our findings demonstrate the critical role of spliceform networks for translating genetic knowledge into a better understanding of human diseases.


Conflict of interest statement

The authors declare no competing financial interests.

Figures

Figure 1
Figure 1. Splicing isoform cloning and construction of autism spliceform network.
(a) The experimental pipeline used to construct ASIN. High-throughput splice isoform discovery and cloning was performed for 191 ASD risk factors using total RNA purified from the pooled foetal and adult whole brain samples. A total of 422 splicing isoforms of these genes were assayed by Y2H screens for interactions against 15,000 human ORFs (ASD422 versus ORFeome) and against themselves (ASD422 versus ASD422) to construct the ASIN with 629 isoform-level PPIs. (b) Novelty assessment of the discovered splice isoforms. Isoform novelty was evaluated based on the annotations from six public databases. The ratios of known and novel cloned isoforms among different categories of ASD risk factors is uniform, with genes with rare mutations having slightly lower number of cloned novel isoforms. Exons used to generate novel isoforms were assigned in the following order: ‘isolated’, ‘extended’, ‘bounded’ and ‘shuffled’. The majority of novel isoforms were generated using ‘bounded’ exons. (c) The examples of cloned isoforms carrying four types of exons. An intronic region of NDE1 is converted into a coding region (‘isolated’); the exon 2 of RIMS3 is extended with an intronic region (‘extended’); the partial deletion of the first two exons of RAPGEF4 (‘bounded’) and a novel exonic combinations in all three genes (‘shuffled’) are shown. The introns are not to scale.
Figure 2
Figure 2. Autism spliceform network quality assessment.
(a) ASIN validation rate in the orthogonal mammalian system MAPPIT. Y-axis shows the fraction of ASIN, positive reference protein pairs set (PRS) and random reference set (RRS) pairs recovered by MAPPIT at increasing RRS recovery rates; 1% RRS recovery rate is indicated by a vertical dotted line. The shading indicates standard error of the proportion. The validation success rate of ASIN is comparable with the rate of true-positive interactions (nASIN=312 versus nRRS=698 P=1.78·10−11; nASIN=312 versus nPRS=460 P=0.85; nPRS=460 versus nRRS=698 P=8.1·10−12; two-sided Wilcoxon rank sum tests). (b) Interacting ASIN pairs are significantly enriched in coexpressed, coregulated and co-GO-annotated protein pairs, as well as in protein pairs forming binary complexes with experimentally solved or homology-modelled structures. The comparison was performed against the background control dataset that consisted of ~1.2 million non-redundant protein pairs generated by pairing each ASIN protein with each protein from the human ORFeome 5.1. P-values were calculated using one-tailed Fisher’s exact test.
Figure 3
Figure 3. Splicing isoform interactions expand ASIN.
(a) ASIN represented as two-component network consisting of reference isoforms PPIs (tan edges) and non-reference isoforms PPIs (blue edges). The network represents an isoform-level network (for the edges) and a gene-level network (for the nodes). The isoforms of the same gene were collapsed into one network node. The interactions from the non-reference isoforms almost doubled the number of ASIN PPIs. Five out of seven interacting partners of the general transcription factor GTF2I were identified by screening its non-reference isoforms (inset I), whereas the majority of interacting partners of the syntaxin protein, STX1A, were identified using its reference isoform (inset II). (b) The histogram represents the number of the isoform-level PPIs (a total of 629) in ASIN coloured according to the isoform type, reference (tan) or non-reference (light blue). The Venn diagram below represents the number of the gene-level PPIs (a total of 506) in ASIN coloured according to the isoform type, reference (tan) or non-reference (light blue). Some genes have PPIs shared by the reference and the non-reference isoforms. (c) Newly identified ASIN interactions (red edges) expand known binary interactions extracted from the published literature (grey edges) by 51%. Inset I shows newly identified (red) and known (grey) interactions of the Forkhead box protein FOXP2; Inset II shows new (red) and known (grey) interactions of the T-box transcription factor TBX6 and RNA-binding protein A2BP1. (d) Alternatively spliced isoforms of A2BP1 protein and their interaction partners. Primers were designed to amplify the A2BP1 ORF that uses the downstream start site (CCDS10531) of the A2BP1 gene with 15 exons that could be alternatively used. The cloned A2BP1 isoforms (two isoforms have novel exon combinations) have three alternatively spliced exons, and inclusion or exclusion of specific exons influences interaction patterns of the isoforms. Alternatively spliced exon 8 (blue, chr16:7680605-7680685); exon 10a (orange, chr16: 7714931-7714970) and exon 10b (green, chr16:7721559-7721601) mediate interactions of the isoforms with different binding partners. The genomic coordinates of exons correspond to hg19 assembly. The interactions (that is, edges) are a consensus of three independent experiments performed in triplicate.
Figure 4
Figure 4. Spliceform interactions connect genes from autism CNVs.
(a) Schematic representation of the CNV–prey and CNV–CNV networks construction. The coloured horizontal bars spanning a chromosomal region represent different de novo CNVs identified in ASD patients. Genes from the same CNVs projected (dashed coloured lines) to the ASIN network are outlined by coloured ellipses. To create a CNV–prey network, baits from the same CNVs were merged into the CNV nodes (large coloured circles) connected by the PPIs from ASIN, and baits that are not in CNVs were removed. To create a CNV–CNV network, preys were also grouped into the CNV nodes connected by the ASIN PPIs. (b) The CNV–prey network (left) identifies 26 preys (larger and darker grey triangles/squares) that bind to significantly greater number of CNV nodes than expected by chance. To identify such preys, the empirical P-value for each prey was estimated using 10,000 degree-preserving rewired networks with exactly the same properties as ASIN. Only preys binding to ≥2 CNVs are shown. Dark blue edges are PPIs supported exclusively by the non-reference isoforms, tan edges—by the reference isoforms, light blue edges—by both isoform types. The control network (right) was selected from 10,000 control networks constructed from the randomly selected genomic regions with the same number of genes with interactions and the same number of interacting partners as in ASIN. This control network represents an example with the greatest number of preys (a total of three) that interact with four CNV nodes using HI-II-11 interactions. Among 10,000 control networks not a single network with the preys that interact with >4 CNV nodes was observed. (c) The CNV–CNV network (left) directly links 27 autism CNVs into a single connected component. Dark blue edges are PPIs supported exclusively by the non-reference isoforms, tan edges—by the reference isoforms, double edges—by both isoform types. The control network (right) represents the network that connects the largest number of CNV nodes. This network was selected from 10,000 control CNV–CNV networks constructed using randomly selected genomic regions with the same number of genes with interactions as in ASIN, connected by HI-II-11 PPIs. All networks were visualized using Cytoscape.
Figure 5
Figure 5. ASIN preys as new protein players in autism.
(a) Integrative analysis of ASIN implicates new players that connect autism genetic risk factors at a protein level. Ten independent sources of evidence (Methods) were used to rank ASIN preys. Thirty one preys accumulated three or more sources of independent evidence. Eleven preys (bold font) have been previously implicated in autism, whereas the remaining twenty (regular font) are newly discovered proteins with strong suggestive evidence for involvement in ASD. (b) The isoform-resolved network of binary physical interactions between highly ranked ASIN preys. Ten proteins in this network were detected in reciprocal configurations (as bait and as prey) in our Y2H screens. The majority of PPIs are supported by non-reference isoforms (dark blue lines), only two PPIs are supported by the reference isoforms (tan lines), and the remaining four by both isoform types (light blue lines). Thicker lines represent PPIs that are also supported by at least one additional functional evidence (coexpression, coregulation, co-GO annotation or complex with solved or homology-modelled structure). The network nodes are grouped according to common functional annotations of genes that were manually curated from the Genome Browser, Entrez Gene Summary and UniProt: transcription (yellow), synaptic transmission (red), cellular transport/localization (purple), SUMOylation/ubiquitination (green) and axon guidance (orange).

References

    1. Iossifov I, et al. De novo gene disruptions in children on the autistic spectrum. Neuron. 2012;74:285–299. doi: 10.1016/j.neuron.2012.04.009. - DOI - PMC - PubMed
    1. Neale BM, et al. Patterns and rates of exonic de novo mutations in autism spectrum disorders. Nature. 2012;485:242–245. doi: 10.1038/nature11011. - DOI - PMC - PubMed
    1. O'Roak BJ, et al. Sporadic autism exomes reveal a highly interconnected protein network of de novo mutations. Nature. 2012;485:246–250. doi: 10.1038/nature10989. - DOI - PMC - PubMed
    1. Sanders SJ, et al. De novo mutations revealed by whole-exome sequencing are strongly associated with autism. Nature. 2012;485:237–241. doi: 10.1038/nature10945. - DOI - PMC - PubMed
    1. Sebat J, et al. Strong association of de novo copy number mutations with autism. Science. 2007;316:445–449. doi: 10.1126/science.1138659. - DOI - PMC - PubMed

Publication types

MeSH terms

Substances

Associated data