

Intrahost dynamics of antiviral resistance in influenza A virus reflect complex patterns of segment linkage, reassortment, and natural selection
- PMID: 25852163
- PMCID: PMC4453542
- DOI: 10.1128/mBio.02464-14
Intrahost dynamics of antiviral resistance in influenza A virus reflect complex patterns of segment linkage, reassortment, and natural selection
Abstract
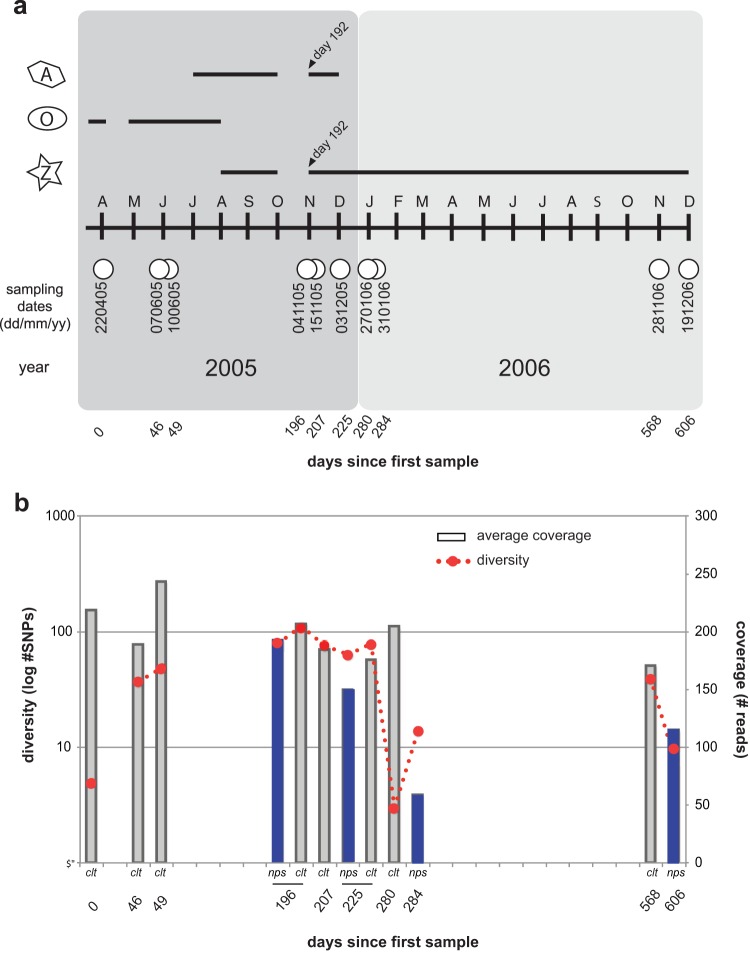
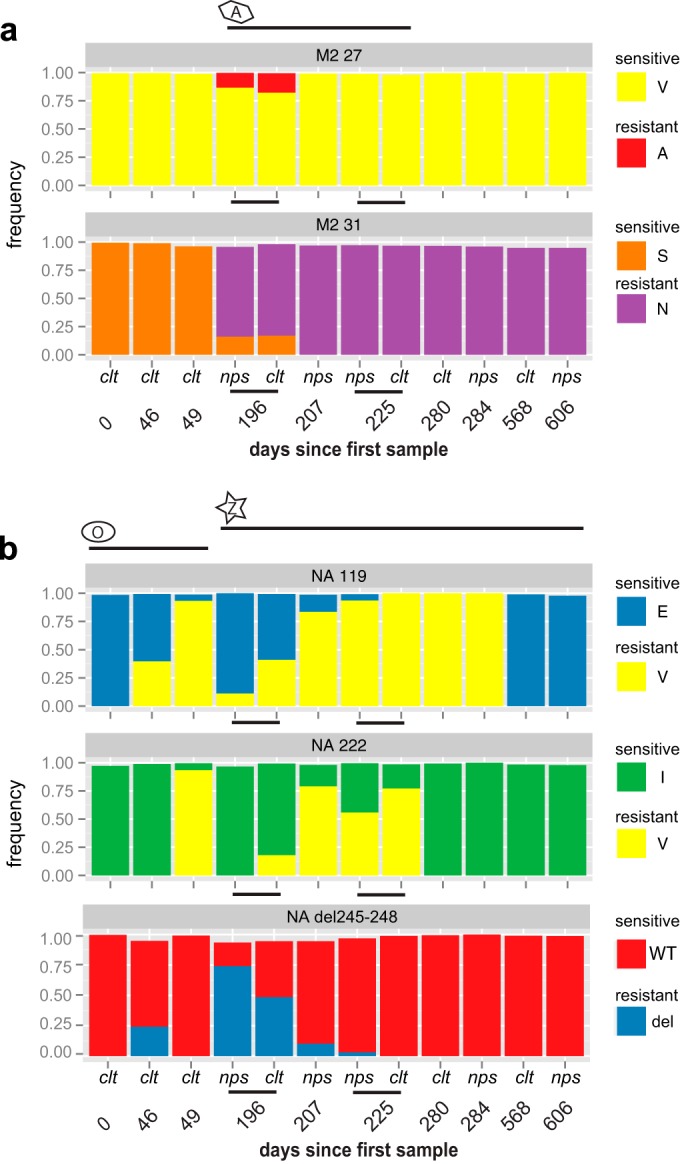
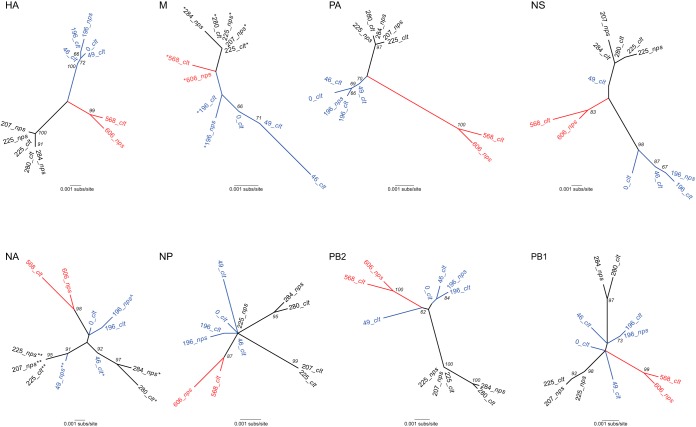
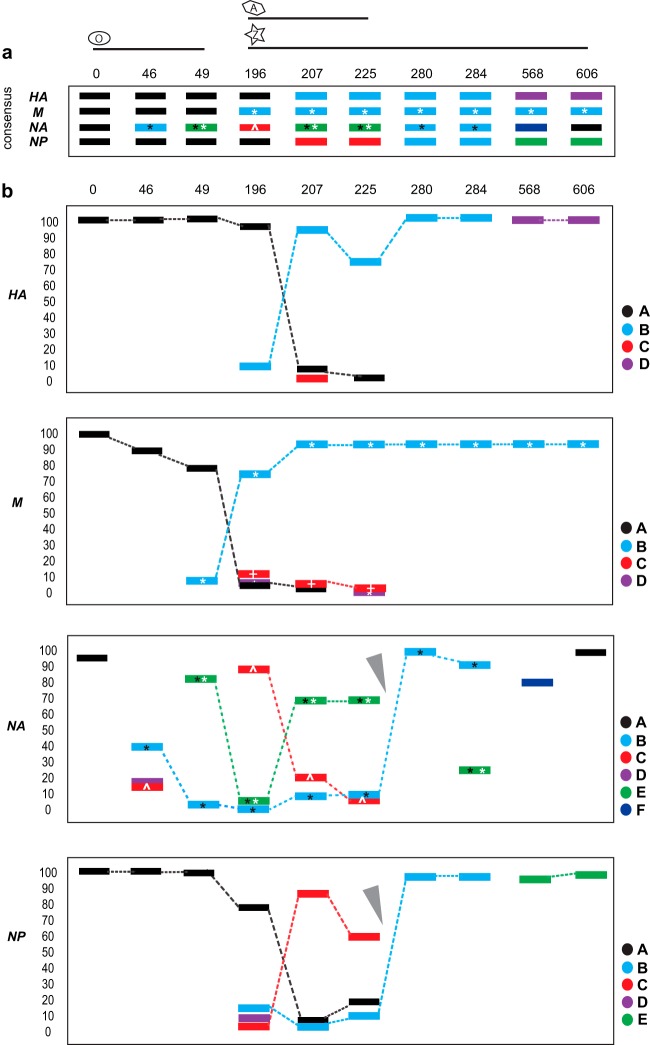
Resistance following antiviral therapy is commonly observed in human influenza viruses. Although this evolutionary process is initiated within individual hosts, little is known about the pattern, dynamics, and drivers of antiviral resistance at this scale, including the role played by reassortment. In addition, the short duration of human influenza virus infections limits the available time window in which to examine intrahost evolution. Using single-molecule sequencing, we mapped, in detail, the mutational spectrum of an H3N2 influenza A virus population sampled from an immunocompromised patient who shed virus over a 21-month period. In this unique natural experiment, we were able to document the complex dynamics underlying the evolution of antiviral resistance. Individual resistance mutations appeared weeks before they became dominant, evolved independently on cocirculating lineages, led to a genome-wide reduction in genetic diversity through a selective sweep, and were placed into new combinations by reassortment. Notably, despite frequent reassortment, phylogenetic analysis also provided evidence for specific patterns of segment linkage, with a strong association between the hemagglutinin (HA)- and matrix (M)-encoding segments that matches that previously observed at the epidemiological scale. In sum, we were able to reveal, for the first time, the complex interaction between multiple evolutionary processes as they occur within an individual host.
Importance: Understanding the evolutionary forces that shape the genetic diversity of influenza virus is crucial for predicting the emergence of drug-resistant strains but remains challenging because multiple processes occur concurrently. We characterized the evolution of antiviral resistance in a single persistent influenza virus infection, representing the first case in which reassortment and the complex patterns of drug resistance emergence and evolution have been determined within an individual host. Deep-sequence data from multiple time points revealed that the evolution of antiviral resistance reflects a combination of frequent mutation, natural selection, and a complex pattern of segment linkage and reassortment. In sum, these data show how immunocompromised hosts may help reveal the drivers of strain emergence.
Copyright © 2015 Rogers et al.
Figures
References
Publication types
MeSH terms
Substances
Associated data
- BioProject/PRJNA253584
- Actions
- Actions
- Actions
- Actions
- Actions
- Actions
- Actions
- Actions
- Actions
- Actions
- Actions
- Actions
- Actions
- Actions
- Actions
- Actions
- Actions
- Actions
- Actions
- Actions
- Actions
- Actions
- Actions
- Actions
- Actions
- Actions
- Actions
- Actions
- Actions
- Actions
- Actions
- Actions
- Actions
- Actions
- Actions
- Actions
- Actions
- Actions
- Actions
- Actions
- Actions
- Actions
- Actions
- Actions
- Actions
- Actions
- Actions
- Actions
- Actions
- Actions
- Actions
- Actions
- Actions
- Actions
- Actions
- Actions
- Actions
- Actions
- Actions
- Actions
- Actions
- Actions
- Actions
- Actions
- Actions
- Actions
- Actions
- Actions
- Actions
- Actions
- Actions
- Actions
- Actions
- Actions
- Actions
- Actions
- Actions
- Actions
- Actions
- Actions
- Actions
- Actions
- Actions
- Actions
- Actions
- Actions
- Actions
- Actions
- Actions
- Actions
- Actions
- Actions
- Actions
- Actions
- Actions
- Actions
Grants and funding
LinkOut - more resources
Full Text Sources
Medical
