. 2016 Apr;48(4):359-66.
doi: 10.1038/ng.3510. Epub 2016 Feb 22.

Recurring exon deletions in the HP (haptoglobin) gene contribute to lower blood cholesterol levels

Affiliations

Recurring exon deletions in the HP (haptoglobin) gene contribute to lower blood cholesterol levels

Linda M Boettger et al. Nat Genet. 2016 Apr.

Abstract

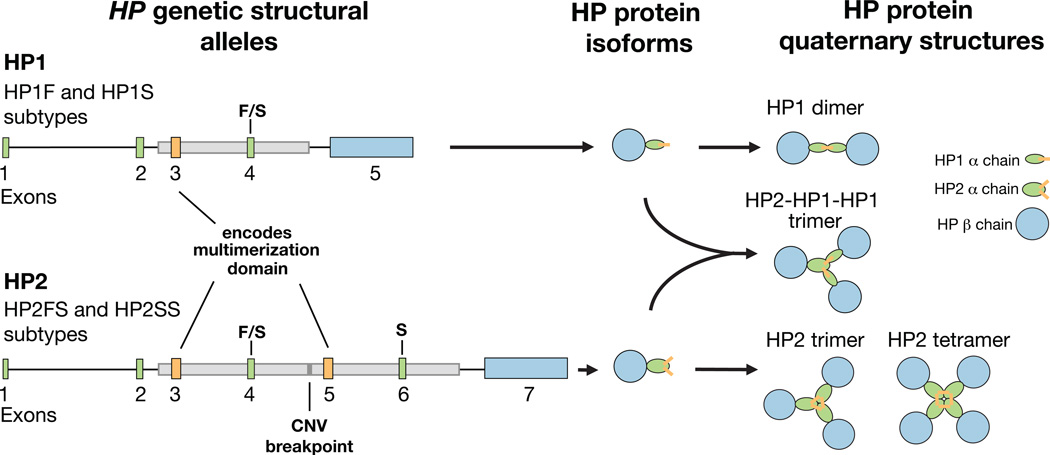
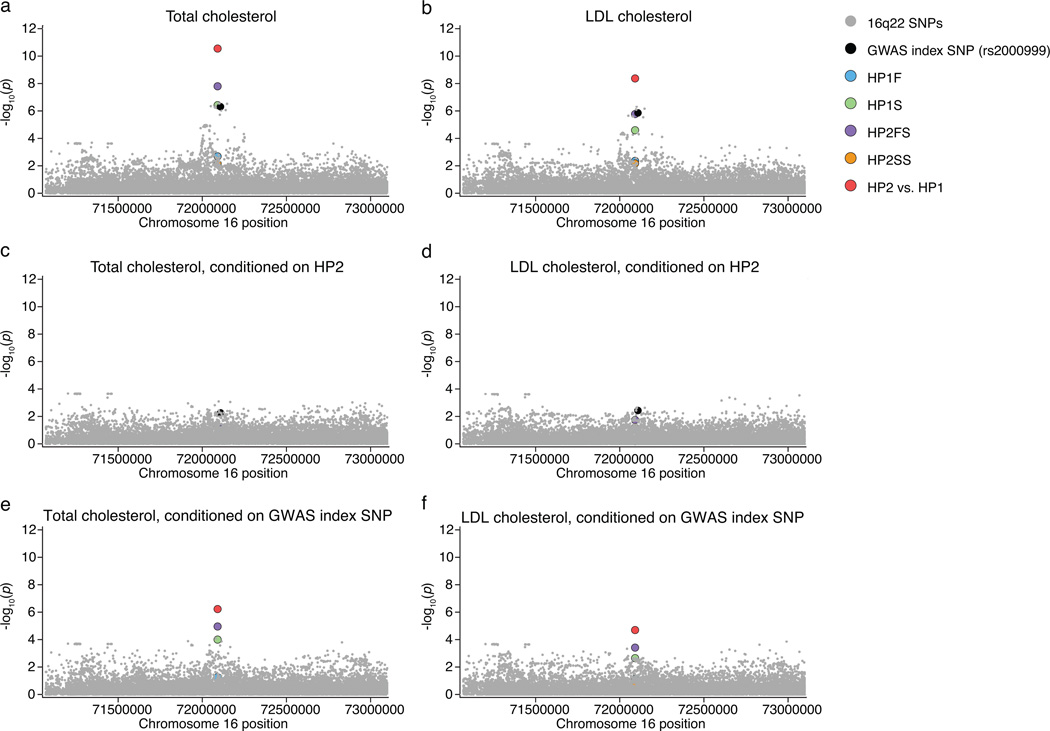
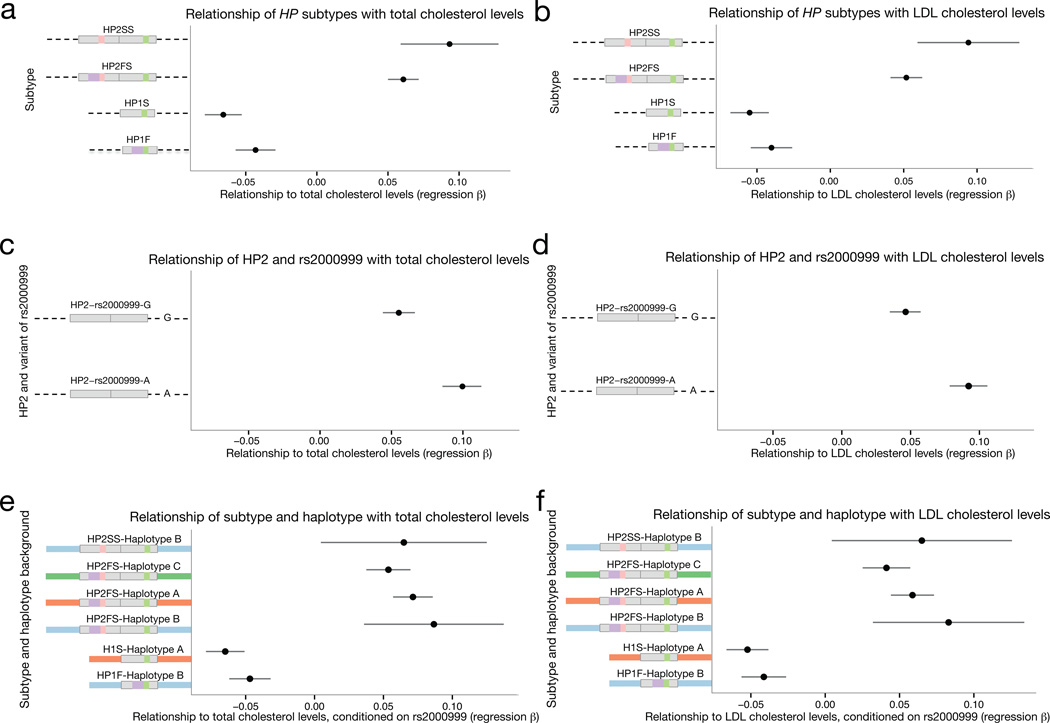
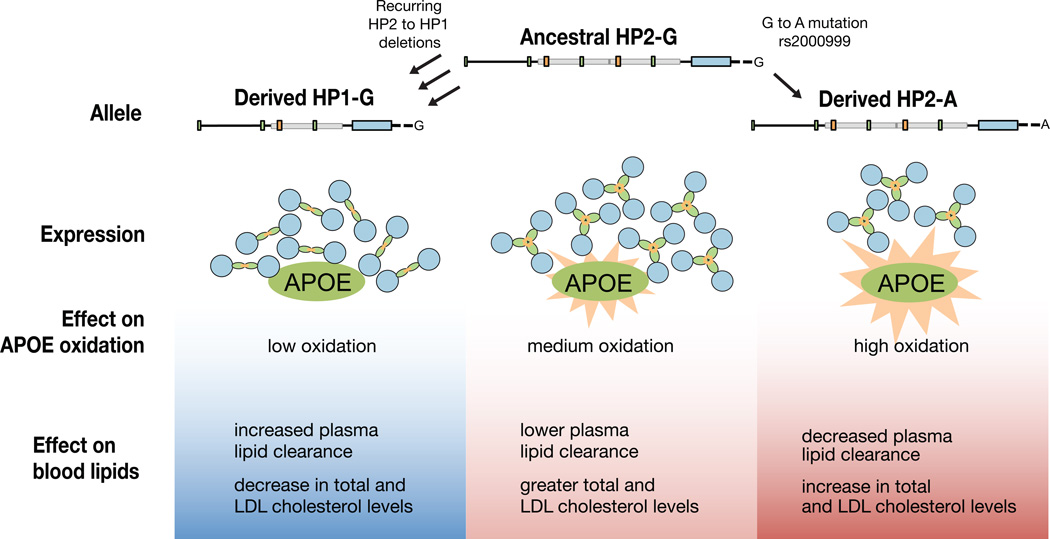
One of the first protein polymorphisms identified in humans involves the abundant blood protein haptoglobin. Two exons of the HP gene (encoding haptoglobin) exhibit copy number variation that affects HP protein structure and multimerization. The evolutionary origins and medical relevance of this polymorphism have been uncertain. Here we show that this variation has likely arisen from many recurring deletions, more specifically, reversions of an ancient hominin-specific duplication of these exons. Although this polymorphism has been largely invisible to genome-wide genetic studies thus far, we describe a way to analyze it by imputation from SNP haplotypes and find among 22,288 individuals that these HP exonic deletions associate with reduced LDL and total cholesterol levels. We further show that these deletions, and a SNP that affects HP expression, appear to drive the strong association of cholesterol levels with SNPs near HP. Recurring exonic deletions in HP likely enhance human health by lowering cholesterol levels in the blood.


Figures

Figure 1
Figure 1. A common CNV in the HP gene is responsible for distinct molecular phenotypes
The HP2 allele contains two additional exons compared to the HP1 allele: exons 3 and 4 are analogous to exons 5 and 6 respectively. The boundaries of the CNV are shown with gray boxs on the gene diagrams. The HP1 allele contains one copy of sequence in exon 3 (orange), which encodes the protein multimerization domain, allowing dimers to be formed. HP2 has two copies of this multimerization domain, which results in the formation of multimers. Exons 4 and 6 (green) contain the F/S mutations responsible for the protein running “Faster” or “Slower” on a gel. The long final exon of HP1 and HP2 encodes the beta subunit of the protein (blue), whereas the earlier exons encode the alpha subunit (green and orange). The alpha and beta subunits are cleaved apart by proteolytic processing after translation but are held together by disulfide bonds. The protein isoform diagrams shown here were modeled after those in an earlier publication.
Figure 2
Figure 2. SNP haplotypes surrounding HP persist through the CNV region, yet segregate with both structural forms of HP
This plot displays the SNP haplotypes (10 kb on each side of the HP CNV) segregating with HP1 and HP2 based on an analysis of 264 samples (528 haplotypes). The upstream SNPs are proximal to the centromere, while the downstream SNPs are distal to the centromere. Each thin horizontal line represents an individual SNP haplotype; similar or identical haplotypes are organized into clusters outlined by colored boxes. Note that the size of small clusters has been increased for visibility purposes and the number of haplotypes contained in each cluster is indicated at the left of the plot. White represents the minor allele and grey indicates the major allele across all populations in the analysis (CEU, IBS, TSI, YRI). Haplotypes ascertained from West African (HapMap YRI) individuals are indicated with lavender bars to the left of the plot, while haplotypes ascertained in European populations (CEU, IBS, TSI) are indicated with dark purple bars to the left of the plot. Haplotypes were clustered with the k-means method using upstream SNP haplotypes. Similar SNP haplotypes carrying different structures are indicated with colored outlines (dark pink, light blue, green, gold) and are designated haplotypes A–D. This figure was based on analysis of 1,000 Genomes Project samples and data (Methods).
Figure 3
Figure 3. SNP haplotypes and sequence differences between HP subtypes inform structural history
(a) This alignment shows base pair differences between HP structural forms analyzed from 27 haplotypes. Only the polymorphic bases are depicted. The HP2FS haplotype contains a 300-bp segment with derived paralogous gene conversion from HPR (lavender) and a 250-bp region that is highly diverged between subtypes (green/pink). Each allele of the highly diverged region contains a mix of ancestral and derived alleles. The dashes reflect a 2-bp and a 7-bp indel; the other sites shown are individual SNPs. The sequence data used to create this alignment are available online (GenBank: KT923758–KT923784). (b) The frequency of each HP haplotype in four populations. (c) The earlier model of HP structural evolution (interchromosomal non-homologous recombination) would predict the HP1F SNP haplotype background (haplotype B) upstream of HP2 and the HP1S SNP haplotype (haplotype A) downstream of HP2. Additionally, it would predict Form R of the highly diverged region in HP2-Left. However, neither of these predictions was observed in any of the HP2 alleles in this study. (d) Both HP1F and HP1S can be created through simple deletions in HP2FS. The dashed lines indicate deleted sequence, while the dashed boxes indicate the sequence required to create each HP1 haplotype. The deletion model is also consistent with the observed SNP haplotype backgrounds surrounding the CNV.
Figure 4
Figure 4. Lone HP1S structural alleles segregate on common HP2FS SNP haplotypes
SNP haplotype data is shown for three European populations (CEU, IBS, TSI) and one African population (YRI) totaling to 528 haplotypes. SNPs on the left half of the plot exist to the left of the HP duplication (proximal to the centromere), whereas SNPs on the right half of the plot physically reside to the right of the duplication (distal to the centromere). Branch points represent markers at which the depicted haplotypes diverge due to mutation and/or recombination with other haplotypes. The structures are represented on the leaves in order to clarify their relationships to SNP haplotypes, but the CNV and the paralogous gene conversion physically reside within the gap at center of the plot. The African individuals are identified with a dot after the leaf. Arrows with numbers indicate HP1 alleles segregating with the standard HP2 SNP haplotypes for at least 20 kb on both sides of the CNV. The + identifies the SNP haplotype branch which carries HP2FS in almost all sampled Africans, but HP1S in all sampled Europeans. This SNP haplotype is identical downstream of the CNV and differs by a single nucleotide upstream of the CNV. The X indicates the single haplotype observed in this study with apparent recombination in the CNV region (B/A in Figure 2). This recombination event appears to be recent because it is identical to standard haplotypes for at least 20 kb on either side of the CNV.
Figure 5
Figure 5. The HP2 allele associates with increased total cholesterol levels and increased LDL cholesterol levels
The imputed structural variants and all regional SNPs imputed from 1,000 Genomes are shown for this analysis of 22,288 individuals. (a,b) The HP2 variant is the highest regional association to both total cholesterol levels (p = 2.79×10⁻¹¹) and LDL cholesterol levels (p = 4.3×10⁻⁹). (c,d) Conditioning on the HP2 variant causes most of the signal to disappear. (e,f) Conditioning on the GWAS index SNP (rs2000999) only has a moderate effect on the association.
Figure 6
Figure 6. The rs2000999-A allele on the HP2 background associated with a greater increase in total cholesterol levels and LDL cholesterol levels
(a,b) The regression beta of HP1 and HP2 alleles with total and LDL cholesterol levels is shown with the standard error is shown for this analysis of 22,288 individuals. (c,d) The regression beta of each allele of rs2000999 with total and LDL cholesterol levels is shown with the standard error. (e,f) The regression beta of each HP subtype and total and LDL cholesterol levels separated by SNP haplotype background is plotted with the standard error. The beta for each HP1 allele was calculated by a comparison with HP2 alleles only, and the beta of HP2 alleles was calculated through a comparison with HP1 alleles only (See Methods and Supplementary Note).
Figure 7
Figure 7. A model for the influence of HP genetic polymorphisms on total and LDL cholesterol levels
Because HP serves as an antioxidant for bound APOE, and HP1 has greater antioxidant activity than HP2, we propose that HP1 alleles (arising from HP2-to-HP1 deletions) lessen the oxidative burden on APOE, allowing it to more effectively clear plasma lipids. Conversely, the rs2000999-A allele decreases HP expression, and thus antioxidant protection for APOE, contributing to elevated cholesterol levels.

Comment in

References

    1. Allison AC, Rees WA. The binding of haemoglobin by plasma proteins (haptoglobins) British medical journal. 1957;2:1137–1143. - PMC - PubMed
    1. Langlois MR, Delanghe JR. Biological and clinical significance of haptoglobin polymorphism in humans. Clinical Chemistry. 1996;42:1589–1600. - PubMed
    1. Smithies O, Walker NF. Genetic control of some serum proteins in normal humans. Nature. 1955;176:1265–1266. - PubMed
    1. Wejman JC, Hovsepian D, Wall JS, Hainfeld JF, Greer J. Structure and assembly of haptoglobin polymers by electron microscopy. J Mol Biol. 1984;174:343–368. - PubMed
    1. Nielsen MJ, Moestrup SK. Receptor targeting of hemoglobin mediated by the haptoglobins: roles beyond heme scavenging. Blood. 2009;114:764–771. - PubMed

Methods-only references

    1. Regan JF, et al. A rapid molecular approach for chromosomal phasing. PLoS ONE. 2015;10:e0118270. - PMC - PubMed
    1. Purcell S, et al. PLINK: a tool set for whole-genome association and population-based linkage analyses. Am. J. Hum. Genet. 2007;81:559–575. - PMC - PubMed
    1. Willer CJ, Li Y, Abecasis GR. METAL: fast and efficient meta-analysis of genomewide association scans. Bioinformatics. 2010;26:2190–2191. - PMC - PubMed

Publication types

Associated data