Virologic effects of broadly neutralizing antibody VRC01 administration during chronic HIV-1 infection
- PMID: 26702094
- PMCID: PMC12366723
- DOI: 10.1126/scitranslmed.aad5752
Virologic effects of broadly neutralizing antibody VRC01 administration during chronic HIV-1 infection
Abstract
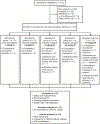
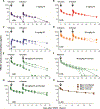
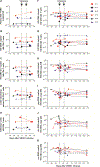
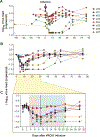
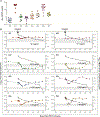
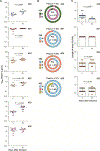
Passive immunization with HIV-1-neutralizing monoclonal antibodies (mAbs) is being considered for prevention and treatment of HIV-1 infection. As therapeutic agents, mAbs could be used to suppress active virus replication, maintain suppression induced by antiretroviral therapy (ART), and/or decrease the size of the persistent virus reservoir. We assessed the impact of VRC01, a potent human mAb targeting the HIV-1 CD4 binding site, on ART-treated and untreated HIV-1-infected subjects. Among six ART-treated individuals with undetectable plasma viremia, two infusions of VRC01 did not reduce the peripheral blood cell-associated virus reservoir measured 4 weeks after the second infusion. In contrast, six of eight ART-untreated, viremic subjects infused with a single dose of VRC01 experienced a 1.1 to 1.8 log10 reduction in plasma viremia. The two subjects with minimal responses to VRC01 were found to have predominantly VRC01-resistant virus before treatment. Notably, two subjects with plasma virus load <1000 copies/ml demonstrated virus suppression to undetectable levels for over 20 days until VRC01 levels declined. Among the remaining four subjects with baseline virus loads between 3000 and 30,000 copies, viremia was only partially suppressed by mAb infusion, and we observed strong selection pressure for the outgrowth of less neutralization-sensitive viruses. In summary, a single infusion of mAb VRC01 significantly decreased plasma viremia and preferentially suppressed neutralization-sensitive virus strains. These data demonstrate the virological effect of this neutralizing antibody and highlight the need for combination strategies to maintain virus suppression.
Trial registration: ClinicalTrials.gov NCT01950325.
Copyright © 2015, American Association for the Advancement of Science.
Conflict of interest statement
Figures
References
-
- Piot P, Abdool Karim SS, Hecht R, Legido-Quigley H, Buse K, Stover J, Resch S, Ryckman T, Møgedal S, Dybul M, Goosby E, Watts C, Kilonzo N, McManus J, Sidibé M; UNAIDS–Lancet Commission, Defeating AIDS—Advancing global health. Lancet 386, 171–218 (2015). - PubMed
-
- Barouch DH, Whitney JB, Moldt B, Klein F, Oliveira TY, Liu J, Stephenson KE, Chang H-W, Shekhar K, Gupta S, Nkolola JP, Seaman MS, Smith KM, Borducchi EN, Cabral C, Smith JY, Blackmore S, Sanisetty S, Perry JR, Beck M, Lewis MG, Rinaldi W, Chakraborty AK, Poignard P, Nussenzweig MC, Burton DR, Therapeutic efficacy of potent neutralizing HIV-1-specific monoclonal antibodies in SHIV-infected rhesus monkeys. Nature 503, 224–228 (2013). - PMC - PubMed
-
- Horwitz JA, Halper-Stromberg A, Mouquet H, Gitlin AD, Tretiakova A, Eisenreich TR, Malbec M, Gravemann S, Billerbeck E, Dorner M, Büning H, Schwartz O, Knops E, Kaiser R, Seaman MS, Wilson JM, Rice CM, Ploss A, Bjorkman PJ, Klein F, Nussenzweig MC, HIV-1 suppression and durable control by combining single broadly neutralizing antibodies and antiretroviral drugs in humanized mice. Proc. Natl. Acad. Sci. U.S.A. 110, 16538–16543 (2013). - PMC - PubMed
-
- Bolton DL, Pegu A, Wang K, McGinnis K, Nason M, Foulds K, Letukas V, Schmidt SD, Chen X, Todd JP, Lifson J, Rao S, Michael NL, Robb ML, Mascola JR, Koup RA, HIV-1 monoclonal antibodies suppress acute SHIV viremia and limit seeding of cell-associated viral reservoirs. J. Virol. JVI.02454–15 (2015). - PMC - PubMed
Publication types
MeSH terms
Substances
Associated data
- Actions
- Actions
- Actions
- Actions
- Actions
- Actions
- Actions
- Actions
- Actions
- Actions
- Actions
- Actions
- Actions
- Actions
- Actions
- Actions
- Actions
- Actions
- Actions
- Actions
- Actions
- Actions
- Actions
- Actions
- Actions
- Actions
- Actions
- Actions
- Actions
- Actions
- Actions
- Actions
- Actions
- Actions
- Actions
- Actions
- Actions
- Actions
- Actions
- Actions
- Actions
- Actions
- Actions
- Actions
- Actions
- Actions
- Actions
- Actions
- Actions
- Actions
- Actions
- Actions
- Actions
- Actions
- Actions
- Actions
- Actions
- Actions
- Actions
- Actions
- Actions
- Actions
- Actions
- Actions
- Actions
- Actions
- Actions
- Actions
- Actions
- Actions
- Actions
- Actions
- Actions
- Actions
- Actions
- Actions
- Actions
- Actions
- Actions
- Actions
- Actions
- Actions
- Actions
- Actions
- Actions
- Actions
- Actions
- Actions
- Actions
- Actions
- Actions
- Actions
- Actions
- Actions
- Actions
- Actions
- Actions
- Actions
- Actions
- Actions
- Actions
- Actions
- Actions
- Actions
- Actions
- Actions
- Actions
- Actions
- Actions
- Actions
- Actions
- Actions
- Actions
- Actions
- Actions
- Actions
- Actions
- Actions
- Actions
- Actions
- Actions
- Actions
- Actions
- Actions
- Actions
- Actions
- Actions
- Actions
- Actions
- Actions
- Actions
- Actions
- Actions
- Actions
- Actions
- Actions
- Actions
- Actions
- Actions
- Actions
- Actions
- Actions
- Actions
- Actions
- Actions
- Actions
- Actions
- Actions
- Actions
- Actions
- Actions
- Actions
- Actions
- Actions
- Actions
- Actions
- Actions
- Actions
- Actions
- Actions
- Actions
- Actions
- Actions
- Actions
- Actions
- Actions
- Actions
- Actions
- Actions
- Actions
- Actions
- Actions
- Actions
- Actions
- Actions
- Actions
- Actions
- Actions
- Actions
- Actions
- Actions
- Actions
- Actions
- Actions
- Actions
- Actions
- Actions
- Actions
- Actions
- Actions
- Actions
- Actions
- Actions
- Actions
- Actions
- Actions
- Actions
- Actions
- Actions
- Actions
- Actions
- Actions
- Actions
- Actions
- Actions
- Actions
- Actions
- Actions
- Actions
- Actions
- Actions
- Actions
- Actions
- Actions
- Actions
- Actions
- Actions
- Actions
- Actions
- Actions
- Actions
- Actions
- Actions
- Actions
- Actions
- Actions
- Actions
- Actions
- Actions
- Actions
- Actions
- Actions
- Actions
- Actions
- Actions
- Actions
- Actions
- Actions
- Actions
- Actions
- Actions
- Actions
- Actions
- Actions
- Actions
- Actions
- Actions
- Actions
- Actions
- Actions
- Actions
- Actions
- Actions
- Actions
- Actions
- Actions
- Actions
- Actions
- Actions
- Actions
- Actions
- Actions
- Actions
- Actions
- Actions
- Actions
- Actions
- Actions
- Actions
- Actions
- Actions
- Actions
- Actions
- Actions
- Actions
- Actions
- Actions
- Actions
- Actions
- Actions
- Actions
- Actions
- Actions
- Actions
- Actions
- Actions
- Actions
- Actions
- Actions
- Actions
- Actions
- Actions
- Actions
- Actions
- Actions
- Actions
- Actions
- Actions
- Actions
- Actions
- Actions
- Actions
- Actions
- Actions
- Actions
- Actions
- Actions
- Actions
- Actions
- Actions
- Actions
- Actions
- Actions
- Actions
- Actions
- Actions
- Actions
- Actions
- Actions
- Actions
- Actions
- Actions
- Actions
- Actions
- Actions
- Actions
- Actions
- Actions
- Actions
- Actions
- Actions
- Actions
- Actions
- Actions
- Actions
- Actions
- Actions
- Actions
- Actions
- Actions
- Actions
- Actions
- Actions
- Actions
- Actions
- Actions
- Actions
- Actions
- Actions
- Actions
- Actions
- Actions
- Actions
- Actions
- Actions
- Actions
- Actions
- Actions
- Actions
- Actions
- Actions
- Actions
- Actions
- Actions
- Actions
- Actions
- Actions
- Actions
- Actions
- Actions
- Actions
- Actions
- Actions
- Actions
- Actions
- Actions
- Actions
- Actions
- Actions
- Actions
- Actions
- Actions
- Actions
- Actions
- Actions
- Actions
- Actions
- Actions
- Actions
- Actions
- Actions
- Actions
- Actions
- Actions
- Actions
- Actions
- Actions
- Actions
- Actions
- Actions
- Actions
- Actions
- Actions
- Actions
- Actions
- Actions
- Actions
- Actions
- Actions
- Actions
- Actions
- Actions
- Actions
- Actions
- Actions
- Actions
- Actions
- Actions
- Actions
- Actions
- Actions
- Actions
- Actions
- Actions
- Actions
- Actions
- Actions
- Actions
- Actions
- Actions
- Actions
- Actions
- Actions
- Actions
- Actions
- Actions
- Actions
- Actions
- Actions
- Actions
- Actions
- Actions
- Actions
- Actions
- Actions
- Actions
- Actions
- Actions
- Actions
- Actions
- Actions
- Actions
- Actions
- Actions
- Actions
- Actions
- Actions
- Actions
- Actions
- Actions
- Actions
- Actions
- Actions
- Actions
- Actions
- Actions
- Actions
- Actions
- Actions
- Actions
- Actions
- Actions
- Actions
- Actions
- Actions
- Actions
- Actions
- Actions
- Actions
- Actions
- Actions
- Actions
- Actions
- Actions
- Actions
- Actions
- Actions
- Actions
- Actions
- Actions
- Actions
- Actions
- Actions
- Actions
- Actions
- Actions
- Actions
- Actions
- Actions
- Actions
- Actions
- Actions
- Actions
- Actions
- Actions
- Actions
- Actions
- Actions
- Actions
- Actions
- Actions
- Actions
- Actions
- Actions
- Actions
- Actions
- Actions
- Actions
- Actions
- Actions
- Actions
- Actions
- Actions
- Actions
- Actions
- Actions
- Actions
- Actions
- Actions
- Actions
- Actions
- Actions
- Actions
- Actions
- Actions
- Actions
- Actions
- Actions
- Actions
- Actions
- Actions
- Actions
- Actions
- Actions
- Actions
- Actions
- Actions
- Actions
- Actions
- Actions
- Actions
- Actions
- Actions
- Actions
- Actions
- Actions
- Actions
- Actions
- Actions
- Actions
- Actions
- Actions
- Actions
- Actions
- Actions
- Actions
- Actions
- Actions
- Actions
- Actions
- Actions
- Actions
- Actions
- Actions
- Actions
- Actions
- Actions
- Actions
- Actions
- Actions
- Actions
- Actions
- Actions
- Actions
- Actions
- Actions
- Actions
- Actions
- Actions
- Actions
- Actions
- Actions
- Actions
- Actions
- Actions
- Actions
- Actions
- Actions
- Actions
- Actions
- Actions
- Actions
- Actions
- Actions
- Actions
- Actions
- Actions
- Actions
- Actions
- Actions
- Actions
- Actions
- Actions
- Actions
- Actions
- Actions
- Actions
- Actions
- Actions
- Actions
- Actions
- Actions
- Actions
- Actions
- Actions
- Actions
- Actions
- Actions
- Actions
- Actions
- Actions
- Actions
- Actions
- Actions
- Actions
- Actions
- Actions
- Actions
- Actions
- Actions
- Actions
- Actions
- Actions
- Actions
- Actions
- Actions
- Actions
- Actions
- Actions
- Actions
- Actions
- Actions
- Actions
- Actions
- Actions
- Actions
- Actions
- Actions
- Actions
- Actions
- Actions
- Actions
- Actions
- Actions
- Actions
- Actions
- Actions
- Actions
- Actions
- Actions
- Actions
- Actions
- Actions
- Actions
- Actions
- Actions
- Actions
- Actions
- Actions
- Actions
- Actions
- Actions
- Actions
- Actions
- Actions
- Actions
- Actions
- Actions
- Actions
- Actions
- Actions
- Actions
- Actions
- Actions
- Actions
- Actions
- Actions
Grants and funding
LinkOut - more resources
Full Text Sources
Other Literature Sources
Medical
Research Materials

