. 2017 Jan 24;114(4):E590-E599.
doi: 10.1073/pnas.1620144114. Epub 2017 Jan 9.

Resistance to type 1 interferons is a major determinant of HIV-1 transmission fitness

Affiliations

Resistance to type 1 interferons is a major determinant of HIV-1 transmission fitness

Shilpa S Iyer et al. Proc Natl Acad Sci U S A. .

Abstract

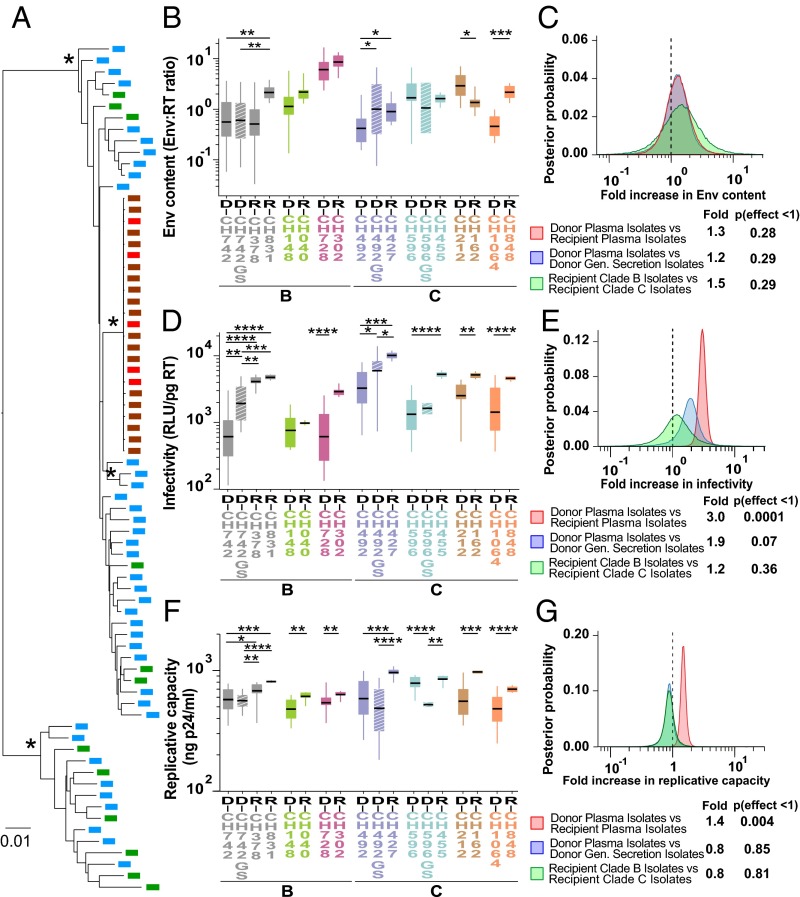
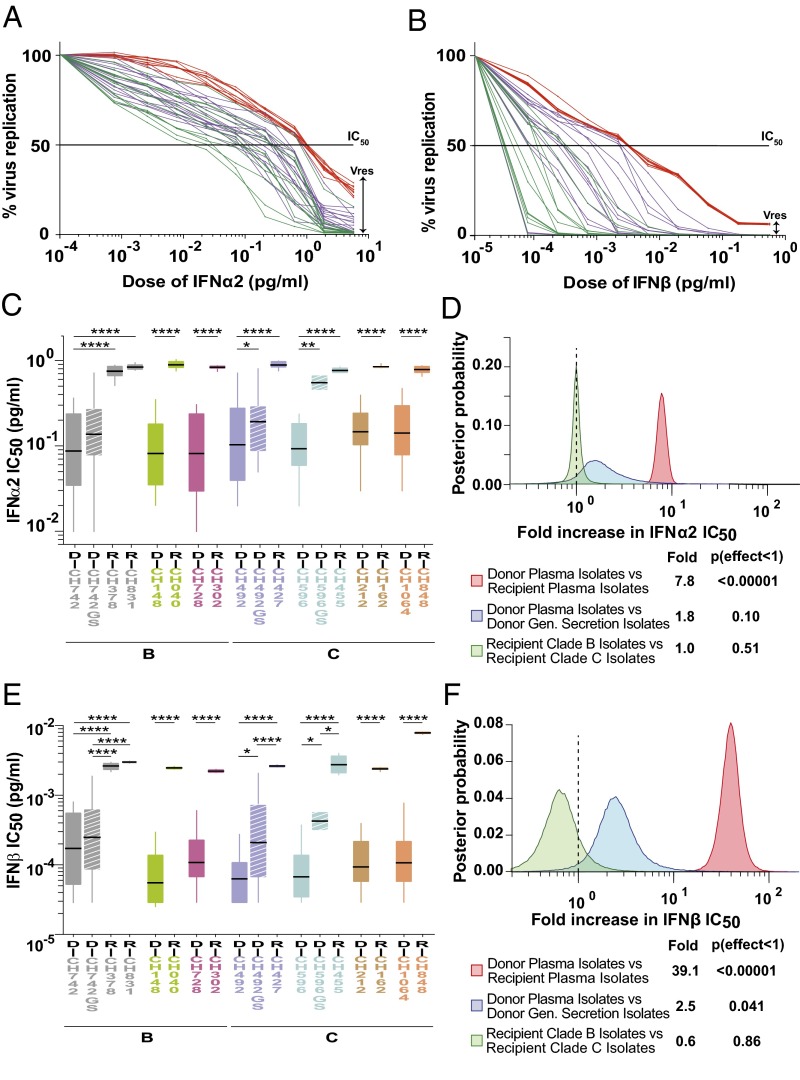
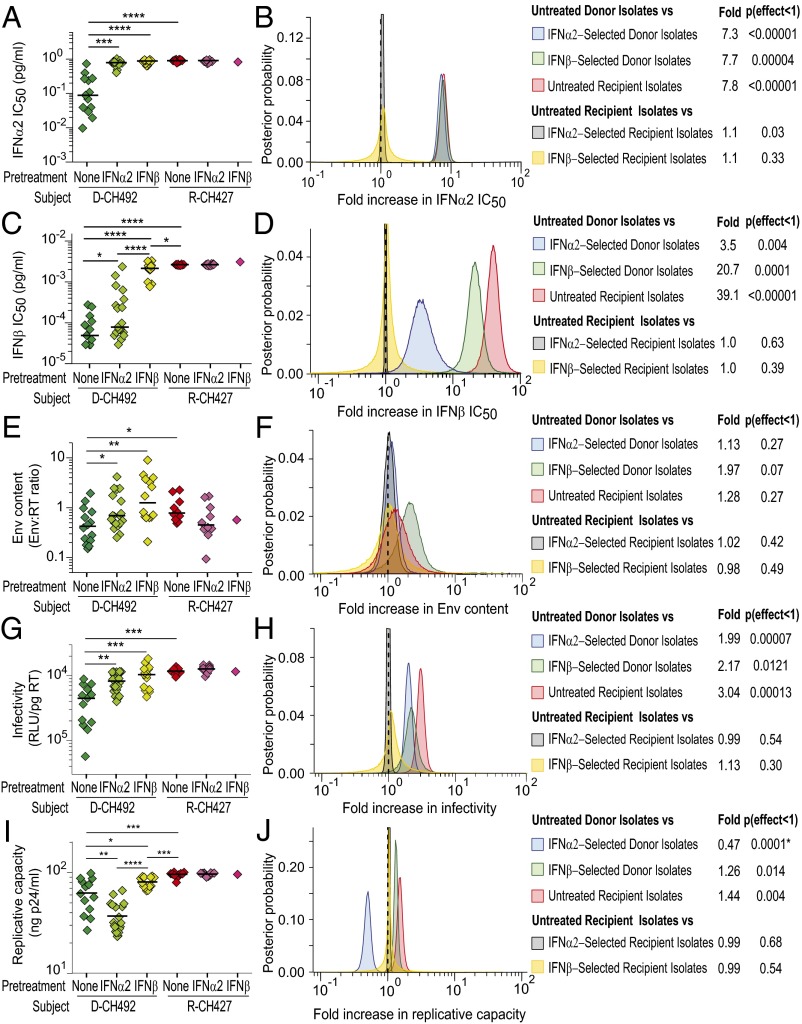
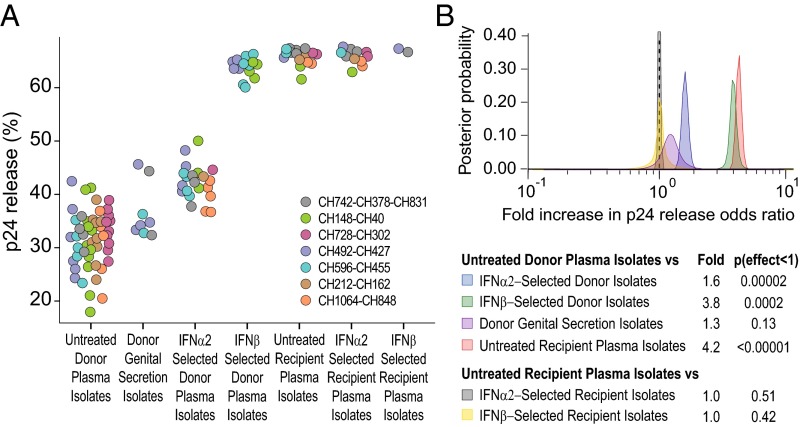
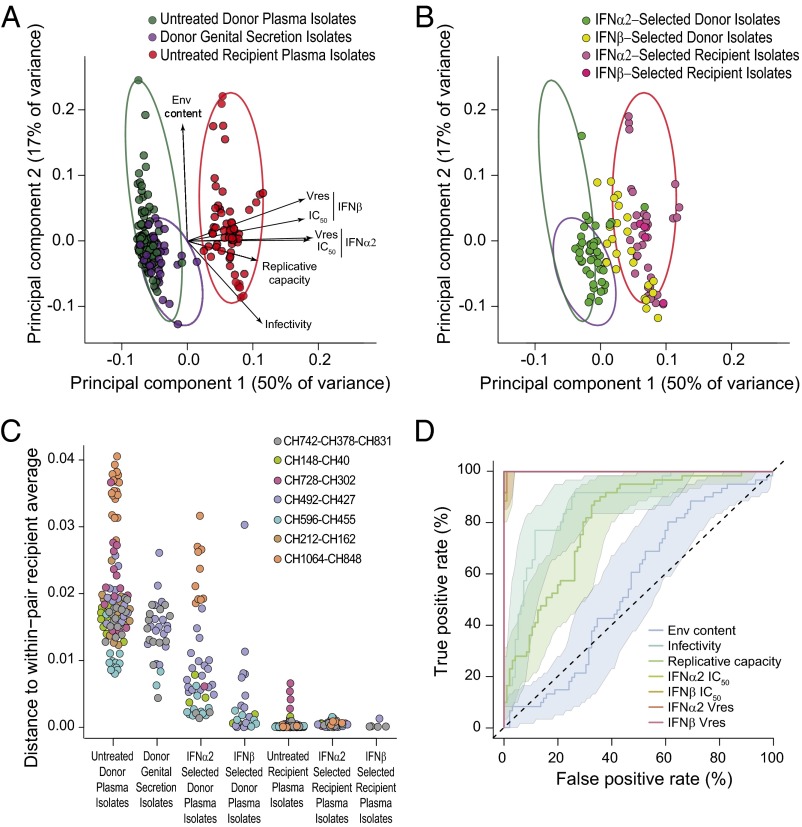
Sexual transmission of HIV-1 is an inefficient process, with only one or few variants of the donor quasispecies establishing the new infection. A critical, and as yet unresolved, question is whether the mucosal bottleneck selects for viruses with increased transmission fitness. Here, we characterized 300 limiting dilution-derived virus isolates from the plasma, and in some instances genital secretions, of eight HIV-1 donor and recipient pairs. Although there were no differences in the amount of virion-associated envelope glycoprotein, recipient isolates were on average threefold more infectious (P = 0.0001), replicated to 1.4-fold higher titers (P = 0.004), were released from infected cells 4.2-fold more efficiently (P < 0.00001), and were significantly more resistant to type I IFNs than the corresponding donor isolates. Remarkably, transmitted viruses exhibited 7.8-fold higher IFNα2 (P < 0.00001) and 39-fold higher IFNβ (P < 0.00001) half-maximal inhibitory concentrations (IC50) than did donor isolates, and their odds of replicating in CD4+ T cells at the highest IFNα2 and IFNβ doses were 35-fold (P < 0.00001) and 250-fold (P < 0.00001) greater, respectively. Interestingly, pretreatment of CD4+ T cells with IFNβ, but not IFNα2, selected donor plasma isolates that exhibited a transmitted virus-like phenotype, and such viruses were also detected in the donor genital tract. These data indicate that transmitted viruses are phenotypically distinct, and that increased IFN resistance represents their most distinguishing property. Thus, the mucosal bottleneck selects for viruses that are able to replicate and spread efficiently in the face of a potent innate immune response.

Keywords: HIV-1 transmission fitness; HIV-1 transmission pairs; innate immunity; mucosal HIV-1 transmission; type I interferons.


Conflict of interest statement

The authors declare no conflict of interest.

Figures

Fig. 1.
Fig. 1.
Genetic and biological characterization of matched donor and recipient limiting dilution-derived isolates. (A) The phylogenetic relationships of donor (green) and recipient (brown) isolate sequences to donor (blue) and recipient (red) SGA-derived plasma viral sequences are shown for the CH596–CH455 transmission pair (maximum likelihood trees for all other transmission pairs are shown in SI Appendix, Fig. S3). Asterisks denote nodes with 100% bootstrap support (the scale bar indicates 0.01 substitutions per site). (B, D, and F) Viral Env content (mass ratio of gp120 and RT), particle infectivity (RLU in TZM-bl cells per picogram of RT), and replicative capacity (p24 antigen levels in CD4+ T-cell culture supernatants 7 d postinfection) of plasma isolates from matched donor (D) and recipient (R) pairs (color coded) are shown, with HIV-1 subtype classification indicated below. Data are grouped for each transmission pair, with genital secretion isolates (GS) shown as hashed boxes. Donor D-CH472 transmitted to two recipients R-CH378 and R-CH831. Boxes show the interquartile range, a black bar within each box indicates the geometric mean, and whiskers span the range of the data, respectively. Asterisks indicate significant differences (determined by unpaired t test) between groups (*P < 0.05; **P < 0.01; ***P < 0.001; ****P < 0.0001). (C, E, and G) Hierarchical Bayesian regression models were used to estimate the population-wide fold change of Env content (C), particle infectivity (E), and replicative capacity (G) across all transmission pairs between donor and recipient plasma isolates (red), donor plasma and genital (Gen) secretion isolates (blue), and clade B and C recipient isolates (green). A dashed line indicates a fold change of 1, indicating no effect. The estimated posterior probability distribution for each parameter is shown along with a table summarizing the expected fold change and the probability that the effect is <1 (analogous to a one-sided P value).
Fig. 2.
Fig. 2.
IFN resistance of matched donor and recipient isolates. (A and B) Dose–response curves for IFNα2 (A) and IFNβ (B) are shown for plasma (green) and genital secretion (magenta) isolates of one chronically infected donor as well as plasma isolates of the corresponding acutely infected recipient (red) of a representative transmission pair (CH492–CH427). A black line indicates the half-maximal inhibitory concentration (IC50) and a double arrow, the residual viral replication (Vres) capacity at the highest IFN dose. (C and E) IFNα2 (C) and IFNβ (E) concentrations (picograms per milliliter), which resulted in 50% viral inhibition, are shown for plasma isolates from matched donor (D) and recipient (R) pairs (color coded as in Fig. 1), with HIV-1 subtype classification indicated below. Data are grouped for each transmission pair, with genital secretion isolates (GS) shown as hashed boxes. Donor D-CH472 transmitted to two recipients R-CH378 and R-CH831. Boxes show the interquartile range, a black bar within each box indicates the geometric mean, and whiskers span the range of the data, respectively. Asterisks indicate significant differences (determined by unpaired t test) between groups (*P < 0.05; **P < 0.01; ***P < 0.001; ****P < 0.0001). IFN IC50 values were determined in pooled CD4+ T cells from multiple donors. (D and F) Hierarchical Bayesian regression models were used to estimate the population-wide fold change of IFNα2 (D) and IFNβ (F) IC50 values across all transmission pairs between donor and recipient plasma isolates (red), donor plasma and genital (Gen) secretion isolates (blue), and clade B and C recipient isolates (green). A dashed vertical line marks a fold change of 1, indicating no effect. The estimated posterior probability distribution for each parameter is shown along with a table summarizing the expected fold change and the probability that the effect is <1 (analogous to a one-sided P value).
Fig. 3.
Fig. 3.
Biological characterization of IFNα2- and IFNβ-selected donor and recipient isolates. (A, C, E, G, and I) IFNα2 IC50 (picograms per milliliter) (A), IFNβ IC50 (picograms per milliliter) (C), viral Env content (mass ratio of gp120 and RT) (E), particle infectivity (RLU per picogram of RT) (G), and replicative capacity in CD4+ T cells (nanograms of p24 antigen per milliliter) (I) values are shown for limiting dilution-derived viral isolates from one representative matched donor (D-CH492) and recipient (R-CH427) pair. In each panel, untreated (dark green), IFNα2-selected (light green), and IFNβ-selected (yellow) isolates from the donor (D-492) are compared with untreated (red), IFNα2-selected (dark pink), and IFNβ-selected (light pink) isolates from the corresponding recipient R-CH427. Boxes show the interquartile range, a black bar within each box indicates the geometric mean, and whiskers span the range of the data, respectively. Asterisks indicate significant differences (determined by unpaired t test) between groups (*P < 0.05; **P < 0.01; ***P < 0.001; ****P < 0.0001). Because IFN selection did not alter the phenotype of recipient isolates, only statistical comparisons of donor isolates to untreated recipient isolates are shown. (B, D, F, H, and J) Hierarchical Bayesian regression models were used to estimate the population-wide fold change of IFNα2 IC50 (B), IFNβ IC50 (D), Env content (F), particle infectivity (H), and replicative capacity in CD4+ T cells (J) across all transmission pairs between untreated and IFNα2-selected donor isolates (blue), untreated and IFNβ-selected donor isolates (green), untreated and IFNα2-selected recipient isolates (gray), and untreated and IFNβ-selected recipient isolates (yellow). The fold change between untreated donor and recipient plasma isolates (red), as in Figs. 1 and 2, is also shown for comparison. A dashed vertical line marks a fold change of 1, indicating no effect. The estimated posterior probability distribution for each parameter is shown along with a table summarizing the expected fold change and the probability that the effect is <1 [or where indicated by an asterisk (*) the probability that the effect is >1].
Fig. 4.
Fig. 4.
Particle release capacity of matched donor and recipient isolates. (A) Donor and recipient isolates were tested for their ability to be released from infected CD4+ T cells. The percent of viral release was determined as the ratio of cell-free p24 divided by the total amount (cell associated plus cell free) of p24 7 d postinfection. Only a subset of isolates (n = 132) was tested. Values are color coded by transmission pair. (B) A hierarchical Bayesian regression model was used to estimate the population-wide fold change in the odds of release (the probability of release divided by the probability of retention) of p24 between untreated and IFNα2-selected donor plasma isolates (blue), untreated and IFNβ-selected donor plasma isolates (green), untreated donor plasma and genital secretion isolates (purple), untreated donor and recipient plasma isolates (red), untreated and IFNα2-selected recipient isolates (gray), and untreated and IFNβ-selected recipient isolates (yellow). A dashed vertical line marks a fold change of 1, indicating no effect. The estimated posterior probability distribution for each parameter is shown along with a table summarizing the expected fold change and the probability that the effect is <1 (analogous to a one-sided P value).
Fig. 5.
Fig. 5.
Phenotypic properties distinguishing donor and recipient isolates. (A) Principal component analysis was used to visualize properties that were determined for all viral isolates (Env content, particle infectivity, replicative capacity, IFNα2 IC50, IFNβ IC50, IFNα2 Vres, and IFNβ Vres) in combination. The positions of untreated donor plasma (green), donor genital secretion (purple), and recipient plasma (red) isolates are shown on the first two components. Length and direction of arrows show how each variable contributes to the two axes. The minimum spanning ellipses that contain all data points for each group are shown in corresponding colors. (B) To visualize the effect of IFN selection, IFNα2-selected (green), and IFNβ-selected (yellow) donor isolates are plotted together with IFNα2-selected (dark pink) and IFNβ-selected (light pink) recipient isolates on the same principal components as in A. Minimum spanning ellipses encompassing the untreated donor plasma isolates (green), donor genital secretion isolates (purple), and untreated recipient plasma isolates (red) as shown in A were retained. (C) To quantify the groupings apparent in A and B, we calculated the distance of the first two principal components for each isolate to the average position of the corresponding untreated recipient isolates for that transmission pair. Isolates are color coded by transmission pairs and grouped as in A and B. (D) The accuracy with which the seven viral properties predicted whether an isolate came from a donor or recipient was measured using receiver operating characteristic curves. Each line indicates the trade-off between true and false positive rates as a threshold is moved through the range of the data. Shading indicates the 95% confidence interval of the true positive rate. The dashed line indicates the expected performance of a predictor with no relationship to donor–recipient status. A line that reaches a true positive rate of 100% with a 0% false positive rate indicates that there is perfect separation between donor and recipient isolates.

References

    1. UNAIDS 2016. Global AIDS Update 2016. Available at www.unaids.org/sites/default/files/media_asset/global-AIDS-update-2016_e.... Accessed December 21, 2016.
    1. Shaw GM, Hunter E. HIV transmission. Cold Spring Harb Perspect Med. 2012;2(11):a006965. - PMC - PubMed
    1. Passmore JA, Jaspan HB, Masson L. Genital inflammation, immune activation and risk of sexual HIV acquisition. Curr Opin HIV AIDS. 2016;11(2):156–162. - PMC - PubMed
    1. Burgener A, McGowan I, Klatt NR. HIV and mucosal barrier interactions: consequences for transmission and pathogenesis. Curr Opin Immunol. 2015;36:22–30. - PubMed
    1. Haynes BF, et al. HIV-host interactions: Implications for vaccine design. Cell Host Microbe. 2016;19(3):292–303. - PMC - PubMed

Publication types

Substances

Associated data