

Causes of blindness and vision impairment in 2020 and trends over 30 years, and prevalence of avoidable blindness in relation to VISION 2020: the Right to Sight: an analysis for the Global Burden of Disease Study
- PMID: 33275949
- PMCID: PMC7820391
- DOI: 10.1016/S2214-109X(20)30489-7
Causes of blindness and vision impairment in 2020 and trends over 30 years, and prevalence of avoidable blindness in relation to VISION 2020: the Right to Sight: an analysis for the Global Burden of Disease Study
Erratum in
-
Correction to Lancet Glob Health 2021; 2: 144-60.Lancet Glob Health. 2021 Apr;9(4):e408. doi: 10.1016/S2214-109X(21)00050-4. Epub 2021 Feb 10. Lancet Glob Health. 2021. PMID: 33581047 Free PMC article. No abstract available.
Abstract
Background: Many causes of vision impairment can be prevented or treated. With an ageing global population, the demands for eye health services are increasing. We estimated the prevalence and relative contribution of avoidable causes of blindness and vision impairment globally from 1990 to 2020. We aimed to compare the results with the World Health Assembly Global Action Plan (WHA GAP) target of a 25% global reduction from 2010 to 2019 in avoidable vision impairment, defined as cataract and undercorrected refractive error.
Methods: We did a systematic review and meta-analysis of population-based surveys of eye disease from January, 1980, to October, 2018. We fitted hierarchical models to estimate prevalence (with 95% uncertainty intervals [UIs]) of moderate and severe vision impairment (MSVI; presenting visual acuity from <6/18 to 3/60) and blindness (<3/60 or less than 10° visual field around central fixation) by cause, age, region, and year. Because of data sparsity at younger ages, our analysis focused on adults aged 50 years and older.
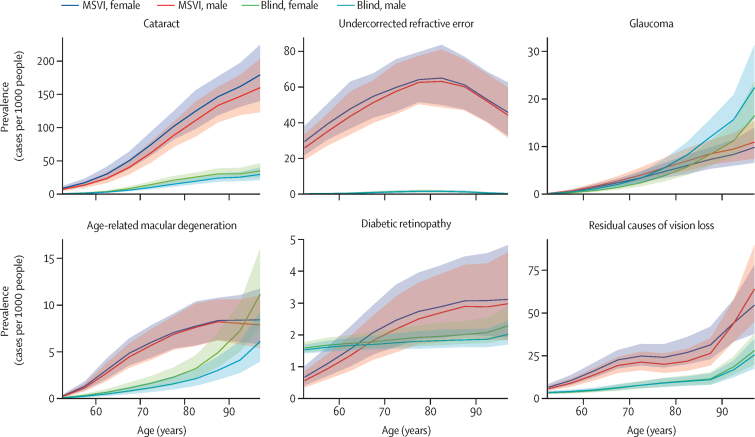
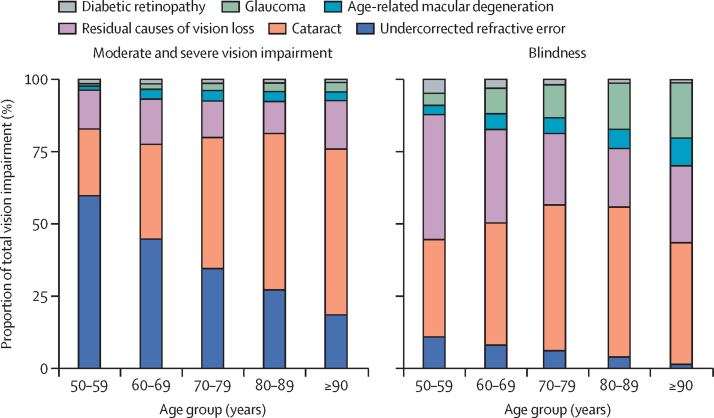
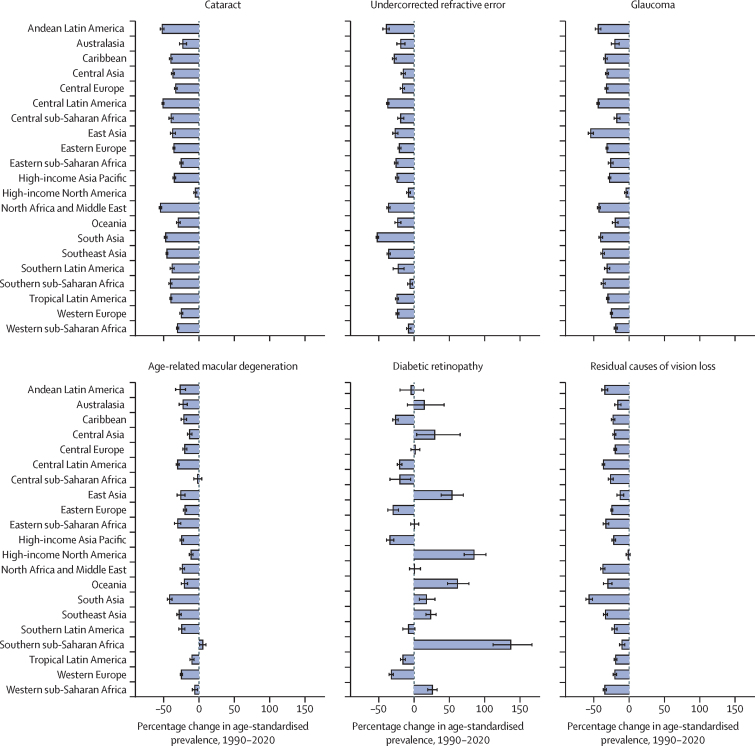
Findings: Global crude prevalence of avoidable vision impairment and blindness in adults aged 50 years and older did not change between 2010 and 2019 (percentage change -0·2% [95% UI -1·5 to 1·0]; 2019 prevalence 9·58 cases per 1000 people [95% IU 8·51 to 10·8], 2010 prevalence 96·0 cases per 1000 people [86·0 to 107·0]). Age-standardised prevalence of avoidable blindness decreased by -15·4% [-16·8 to -14·3], while avoidable MSVI showed no change (0·5% [-0·8 to 1·6]). However, the number of cases increased for both avoidable blindness (10·8% [8·9 to 12·4]) and MSVI (31·5% [30·0 to 33·1]). The leading global causes of blindness in those aged 50 years and older in 2020 were cataract (15·2 million cases [9% IU 12·7-18·0]), followed by glaucoma (3·6 million cases [2·8-4·4]), undercorrected refractive error (2·3 million cases [1·8-2·8]), age-related macular degeneration (1·8 million cases [1·3-2·4]), and diabetic retinopathy (0·86 million cases [0·59-1·23]). Leading causes of MSVI were undercorrected refractive error (86·1 million cases [74·2-101·0]) and cataract (78·8 million cases [67·2-91·4]).
Interpretation: Results suggest eye care services contributed to the observed reduction of age-standardised rates of avoidable blindness but not of MSVI, and that the target in an ageing global population was not reached.
Funding: Brien Holden Vision Institute, Fondation Théa, The Fred Hollows Foundation, Bill & Melinda Gates Foundation, Lions Clubs International Foundation, Sightsavers International, and University of Heidelberg.
Copyright © 2021 The Author(s). Published by Elsevier Ltd. This is an Open Access article under the CC BY 4.0 license. Published by Elsevier Ltd.. All rights reserved.
Figures
Comment in
-
Rising to the challenge: estimates of the magnitude and causes of vision impairment and blindness.Lancet Glob Health. 2021 Feb;9(2):e100-e101. doi: 10.1016/S2214-109X(21)00008-5. Lancet Glob Health. 2021. PMID: 33482137 Free PMC article. No abstract available.
References
-
- Flaxman SR, Bourne RRA, Resnikoff S. Global causes of blindness and distance vision impairment 1990-2020: a systematic review and meta-analysis. Lancet Glob Health. 2017;5:e1221–e1234. - PubMed
-
- Reddy PA, Congdon N, MacKenzie G. Effect of providing near glasses on productivity among rural Indian tea workers with presbyopia (PROSPER): a randomised trial. Lancet Glob Health. 2018;6:e1019–e1027. - PubMed
Publication types
MeSH terms
Grants and funding
LinkOut - more resources
Full Text Sources
Other Literature Sources
Medical
Miscellaneous
