. 2025 Mar 26;7(2):dlaf037.
doi: 10.1093/jacamr/dlaf037. eCollection 2025 Apr.

The impact of the COVID-19 pandemic on antimicrobial usage: an international patient-level cohort study

Collaborators, Affiliations

The impact of the COVID-19 pandemic on antimicrobial usage: an international patient-level cohort study

Refath Farzana et al. JAC Antimicrob Resist. .

Abstract

Background: This study aimed to evaluate the trends in antimicrobial prescription during the first 1.5 years of COVID-19 pandemic.

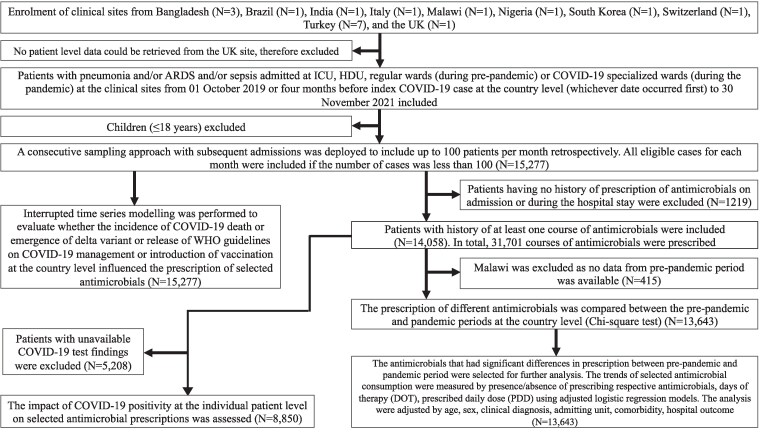
Methods: This was an observational, retrospective cohort study using patient-level data from Bangladesh, Brazil, India, Italy, Malawi, Nigeria, South Korea, Switzerland and Turkey from patients with pneumonia and/or acute respiratory distress syndrome and/or sepsis, regardless of COVID-19 positivity, who were admitted to critical care units or COVID-19 specialized wards. The changes of antimicrobial prescription between pre-pandemic and pandemic were estimated using logistic or linear regression. Pandemic effects on month-wise antimicrobial usage were evaluated using interrupted time series analyses (ITSAs).

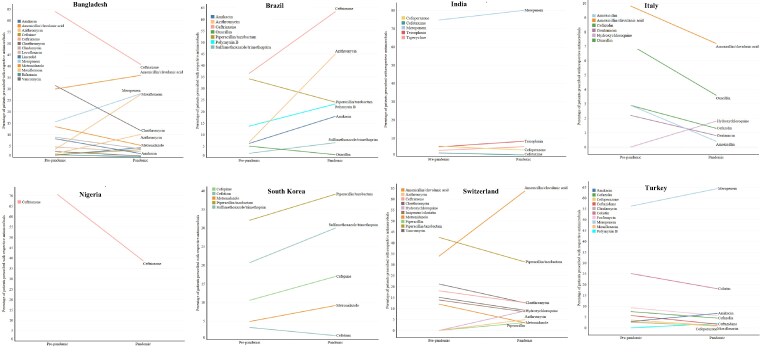
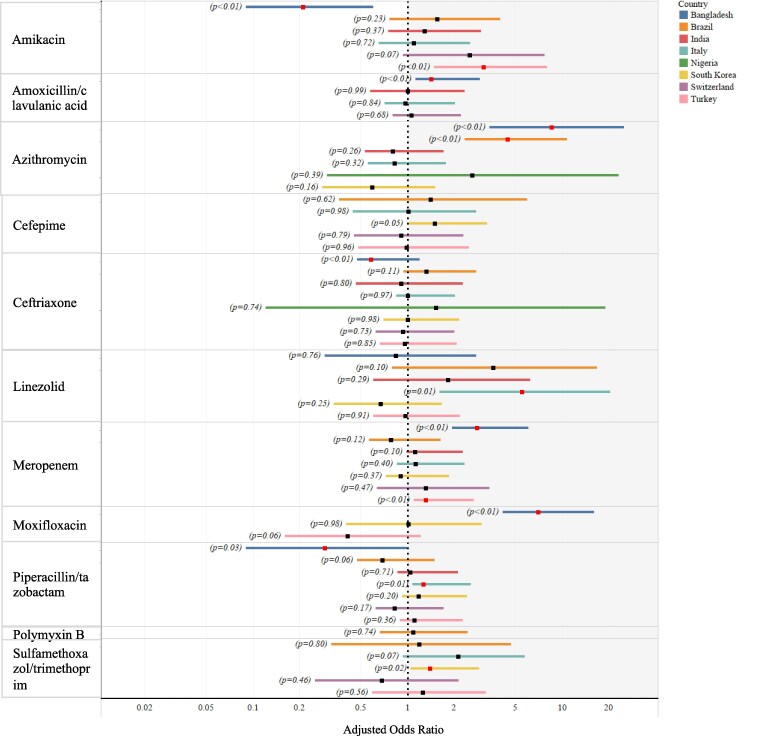
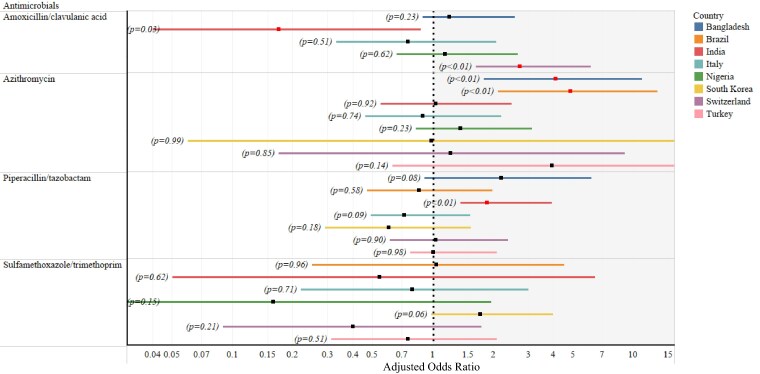
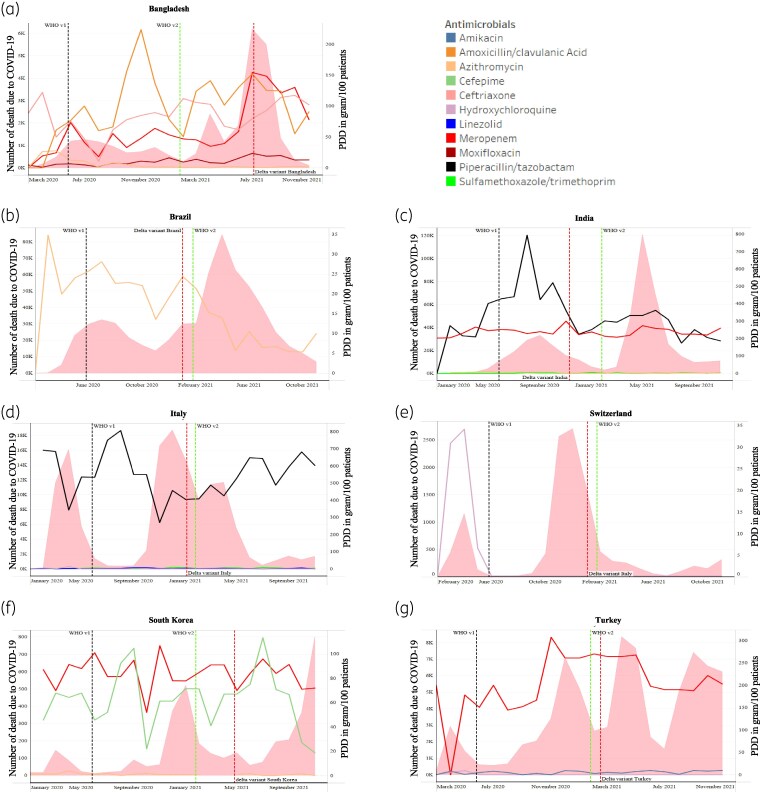
Results: Antimicrobials for which prescriptions significantly increased during the pandemic were as follows: meropenem in Bangladesh (95% CI: 1.94-4.07) with increased prescribed daily dose (PDD) (95% CI: 1.17-1.58) and Turkey (95% CI: 1.09-1.58), moxifloxacin in Bangladesh (95% CI: 4.11-11.87) with increased days of therapy (DOT) (95% CI: 1.14-2.56), piperacillin/tazobactam in Italy (95% CI: 1.07-1.48) with increased DOT (95% CI: 1.01-1.25) and PDD (95% CI: 1.05-1.21) and azithromycin in Bangladesh (95% CI: 3.36-21.77) and Brazil (95% CI: 2.33-8.42). ITSA showed a significant drop in azithromycin usage in India (95% CI: -8.38 to -3.49 g/100 patients) and South Korea (95% CI: -2.83 to -1.89 g/100 patients) after WHO guidelines v1 release and increased meropenem usage (95% CI: 93.40-126.48 g/100 patients) and moxifloxacin (95% CI: 5.40-13.98 g/100 patients) in Bangladesh and sulfamethoxazole/trimethoprim in India (95% CI: 0.92-9.32 g/100 patients) following the Delta variant emergence.

Conclusions: This study reinforces the importance of developing antimicrobial stewardship in the clinical settings during inter-pandemic periods.


Figures

Figure 1.
Figure 1.
Study flow diagram.
Figure 2.
Figure 2.
Line graph showing the trends of respective antimicrobial prescriptions from the pre-pandemic to pandemic period at the country level. The ‘x’ axis represents the percentage of patients prescribed with respective antimicrobials. No pre-pandemic data on antimicrobials were available from the Malawi site. Patient-level data could not be accessed from the UK site. Only antimicrobials with significant differences (by chi-square test) in usage between pre-pandemic and pandemic are included in this figure. The antimicrobials with a very low frequency of prescriptions (n < 15) are excluded from the figure. Tables S7–S14 demonstrate the differences in usage of all antimicrobials in each country included in this study.
Figure 3.
Figure 3.
Plot represents the comparison of prescriptions of respective antimicrobials between the pre-pandemic and pandemic periods at the country level. Horizontal bars represent the lower and upper values of a 95% CI. Black square symbols represent the odds ratio, and red square symbols represent tests with significant differences in the prescription of respective antimicrobials between pre-pandemic and pandemic periods. Antimicrobials with <15 prescriptions overall are excluded from the analysis. Statistical analysis was performed using logistic regression. All models are adjusted for age (continuous), sex (male/female/other), admitting ward [ICU/HDU/DCC/COVID specialized (including regular wards for the pre-pandemic period)], comorbidities (binary, yes or no), patient outcome (died/discharged alive) and diagnosis type (sepsis only/pneumonia only/ARDs only/sepsis and pneumonia/sepsis and ARDs/pneumonia and ARDs/sepsis, pneumonia and ARDS). Comparisons of antimicrobial prescriptions between pre-pandemic and pandemic could not be performed using logistic regression if there was a null value either for the pre-pandemic or pandemic period. The difference in amoxicillin/clavulanic acid for Nigeria was not shown in the figure as the adjusted mean difference was zero.
Figure 4.
Figure 4.
Plot represents the comparison of prescriptions of respective antimicrobials between COVID-19-positive and COVID-19-negative cases at the country level. Horizontal bars represent the lower and upper values of a 95% CI. Black square symbols represent the odds ratio, and red square symbols represent the significant differences in the prescription of respective antimicrobials between COVID-19-positive and COVID-19-negative cases. The antimicrobials with the <15 prescriptions overall are excluded from the analysis. Statistical analysis was performed using logistic regression. All models are adjusted for age (continuous), sex (male/female/other), admitting ward [ICU/HDU/DCC/COVID specialized (including regular wards for the pre-pandemic period)], comorbidities (binary, yes or no), patient outcome (died/discharged alive) and diagnosis type (sepsis only/pneumonia only/ARDS only/sepsis and pneumonia/sepsis and ARDS/pneumonia and ARDS/sepsis, pneumonia and ARDS). Comparisons of antimicrobial prescriptions between COVID-19-positive and COVID-19-negative cases could not be performed using logistic regression if there was a null value either for COVID-19-positive or COVID-19-negative cases.
Figure 5.
Figure 5.
The figures (a-g) represent the mapping of selected antimicrobials at the country level (antimicrobials that were shown to be used significantly during the pandemic using adjusted logistic regression model) with the month-wise incidence of death (represented by pink area plot) and emergence of Delta variant (represented by red dotted line) at the country level and release of WHO guidelines version 1 (represented by black dotted line) and version 2 (represented by green dotted line) on COVID-19 management. Data on incidence of COVID-19 death and COVID-19 vaccination were downloaded from https://data.who.int/dashboards/covid19/data. Data on COVID-19 variants were downloaded from https://ourworldindata.org/grapher/covid-variants-bar. Dates relevant to this figure have been complied with in Table S17. Line plots represent the month-wise PDD of respective antimicrobials in grams per 100 patients.

References

    1. WHO . COVID-19 Public Health Emergency of International Concern (PHEIC) Global Research and Innovation Forum. https://www.who.int/publications/m/item/covid-19-public-health-emergency....
    1. Luqmani YA, El Hashim A. The COVID-19 pandemic: a health crisis managed or a panic response with disastrous future consequences? Med Princ Pract 2022; 31: 1–10. 10.1159/000520258 - DOI - PMC - PubMed
    1. Filip R, Gheorghita Puscaselu R, Anchidin-Norocel L et al. Global challenges to public health care systems during the COVID-19 pandemic: a review of pandemic measures and problems. J Pers Med 2022; 12: 1295. 10.3390/jpm12081295 - DOI - PMC - PubMed
    1. Alsuhaibani M, Kobayashi T, McPherson C et al. Impact of COVID-19 on an infection prevention and control program, Iowa 2020–2021. Am J Infect Control 2022; 50: 277–82. 10.1016/j.ajic.2021.11.015 - DOI - PMC - PubMed
    1. Rawson TM, Ming D, Ahmad R et al. Antimicrobial use, drug-resistant infections and COVID-19. Nat Rev Microbiol 2020; 18: 409–10. 10.1038/s41579-020-0395-y - DOI - PMC - PubMed

LinkOut - more resources