. 2023 Apr;7(4):484-501.
doi: 10.1038/s41562-022-01517-1. Epub 2023 Feb 9.

Insights into the accuracy of social scientists' forecasts of societal change

Collaborators

Insights into the accuracy of social scientists' forecasts of societal change

Forecasting Collaborative. Nat Hum Behav. 2023 Apr.

Abstract

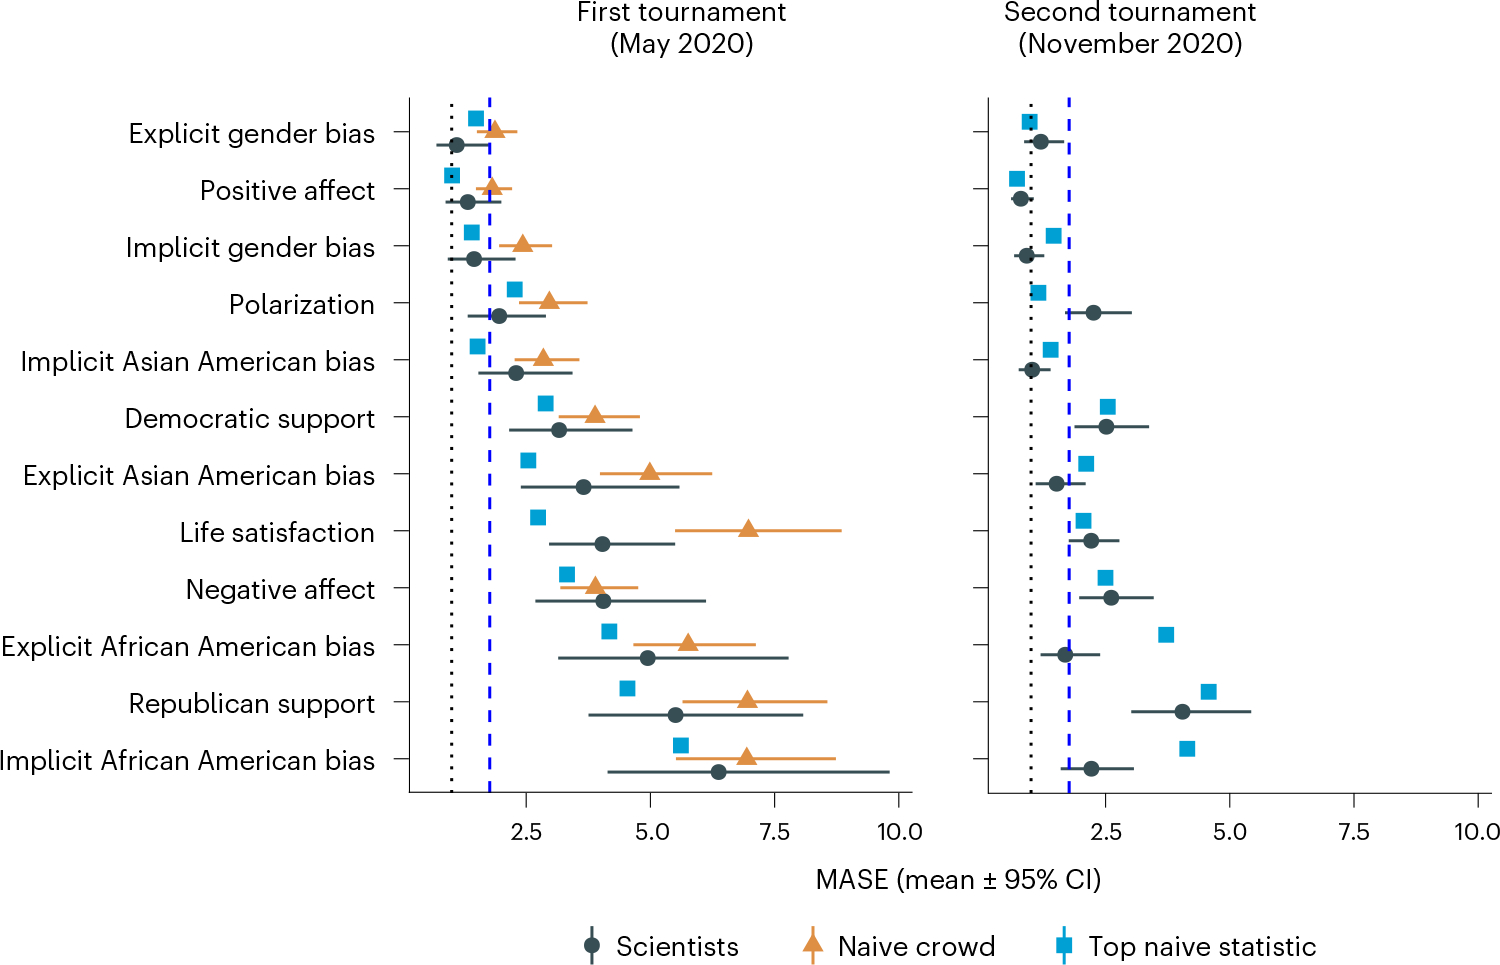
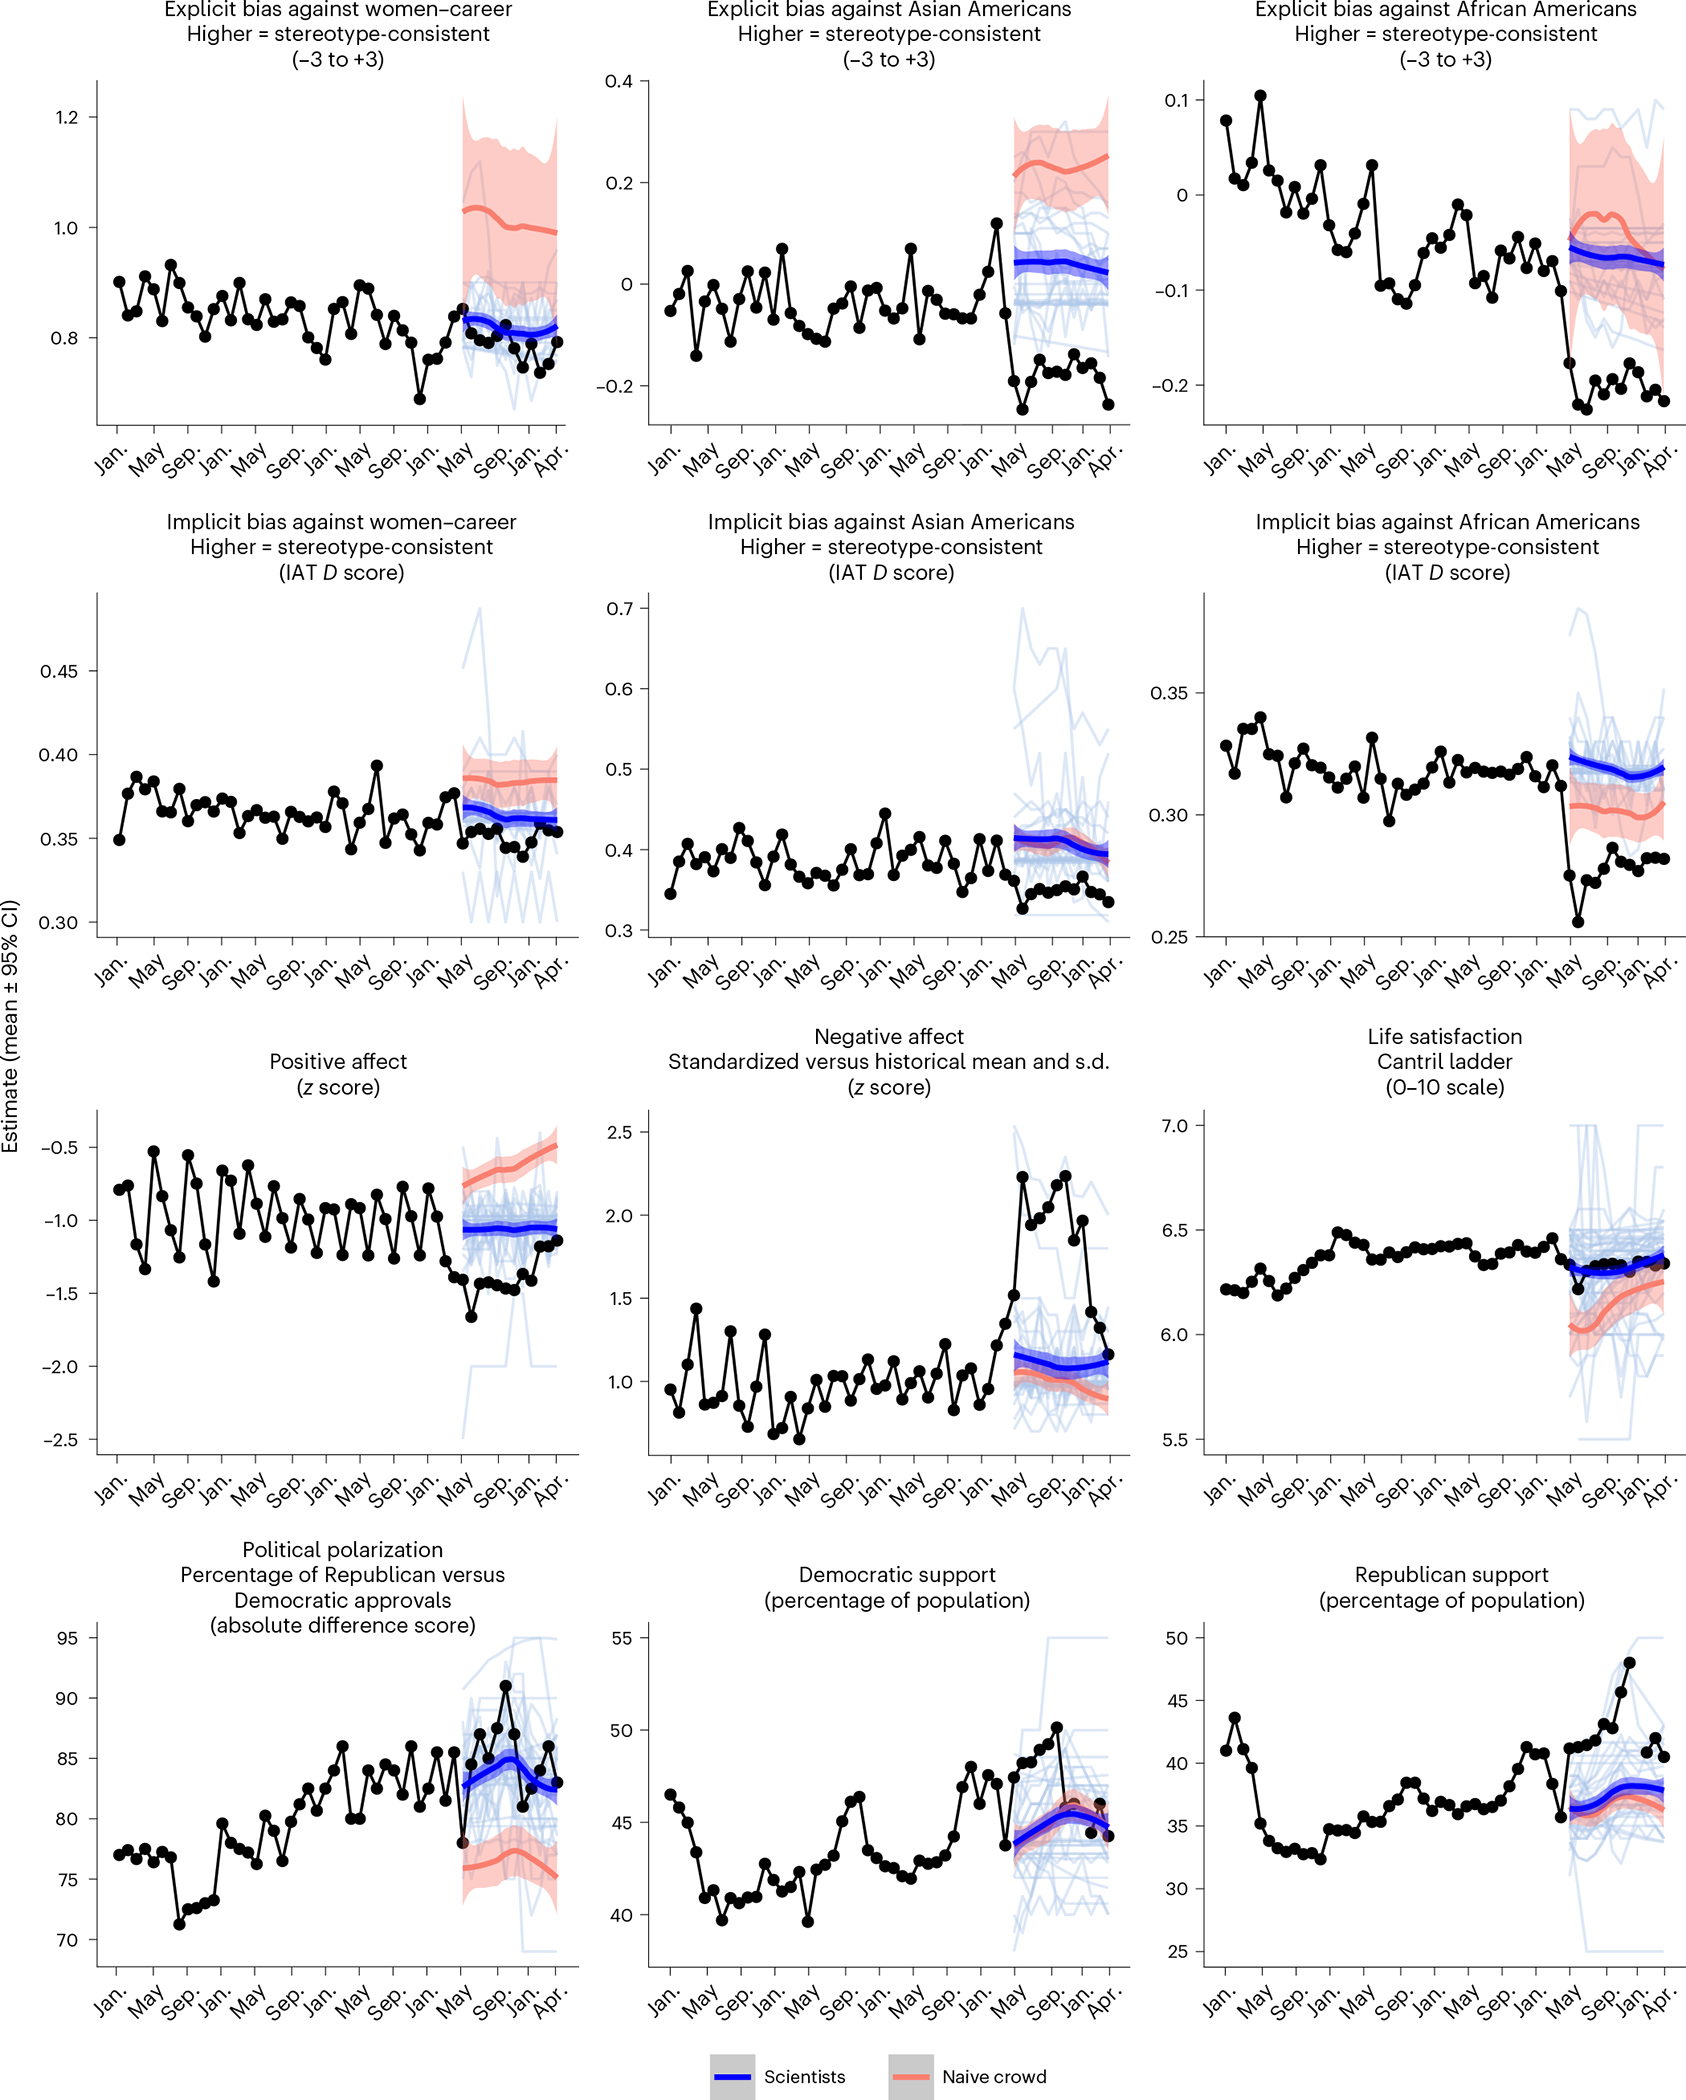
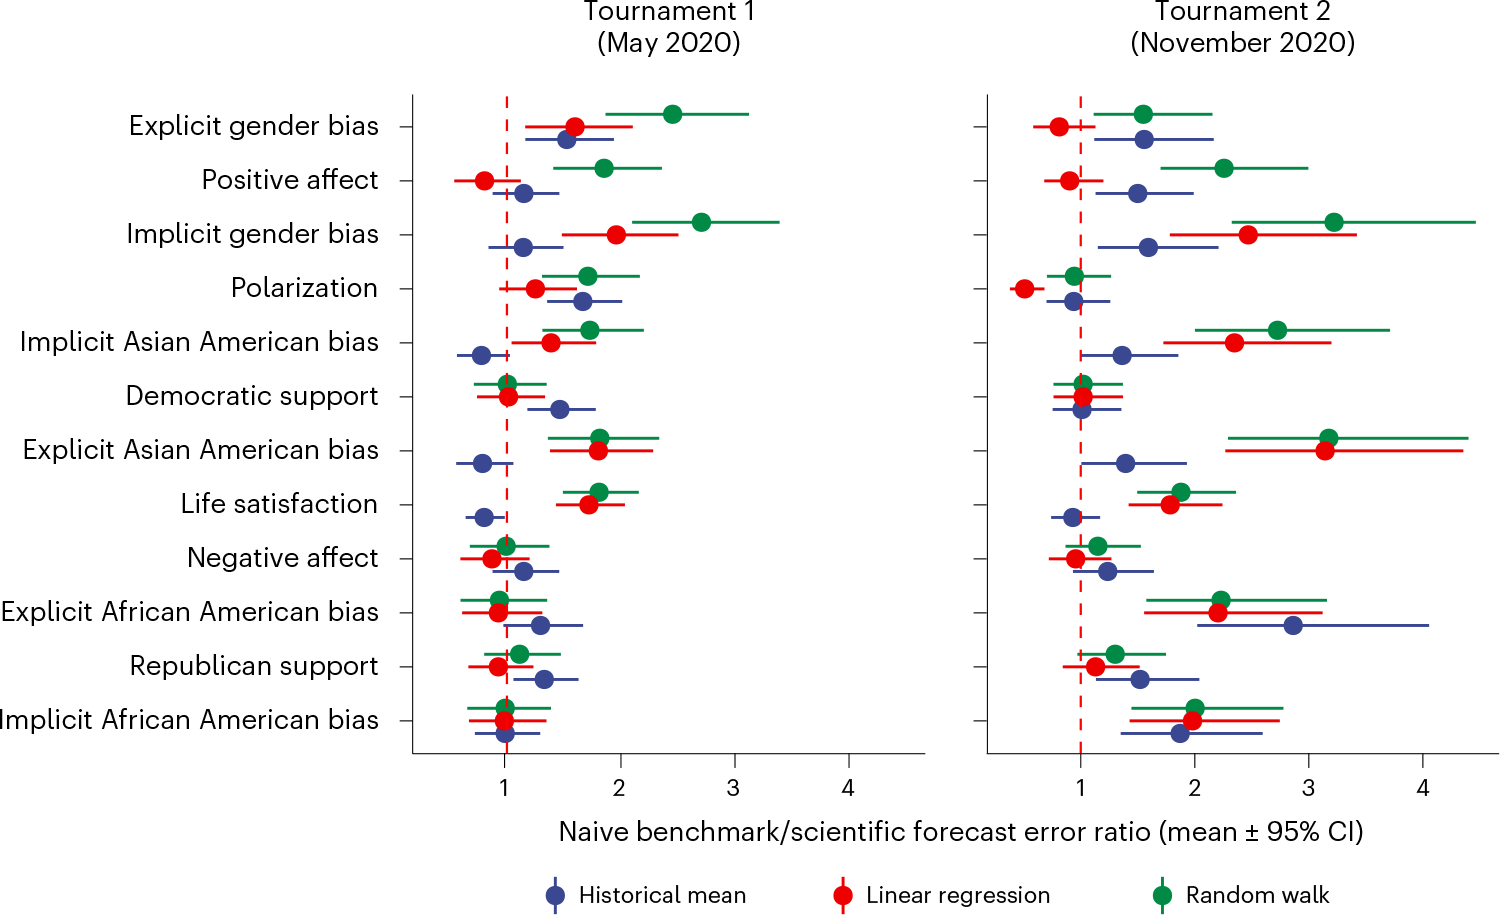
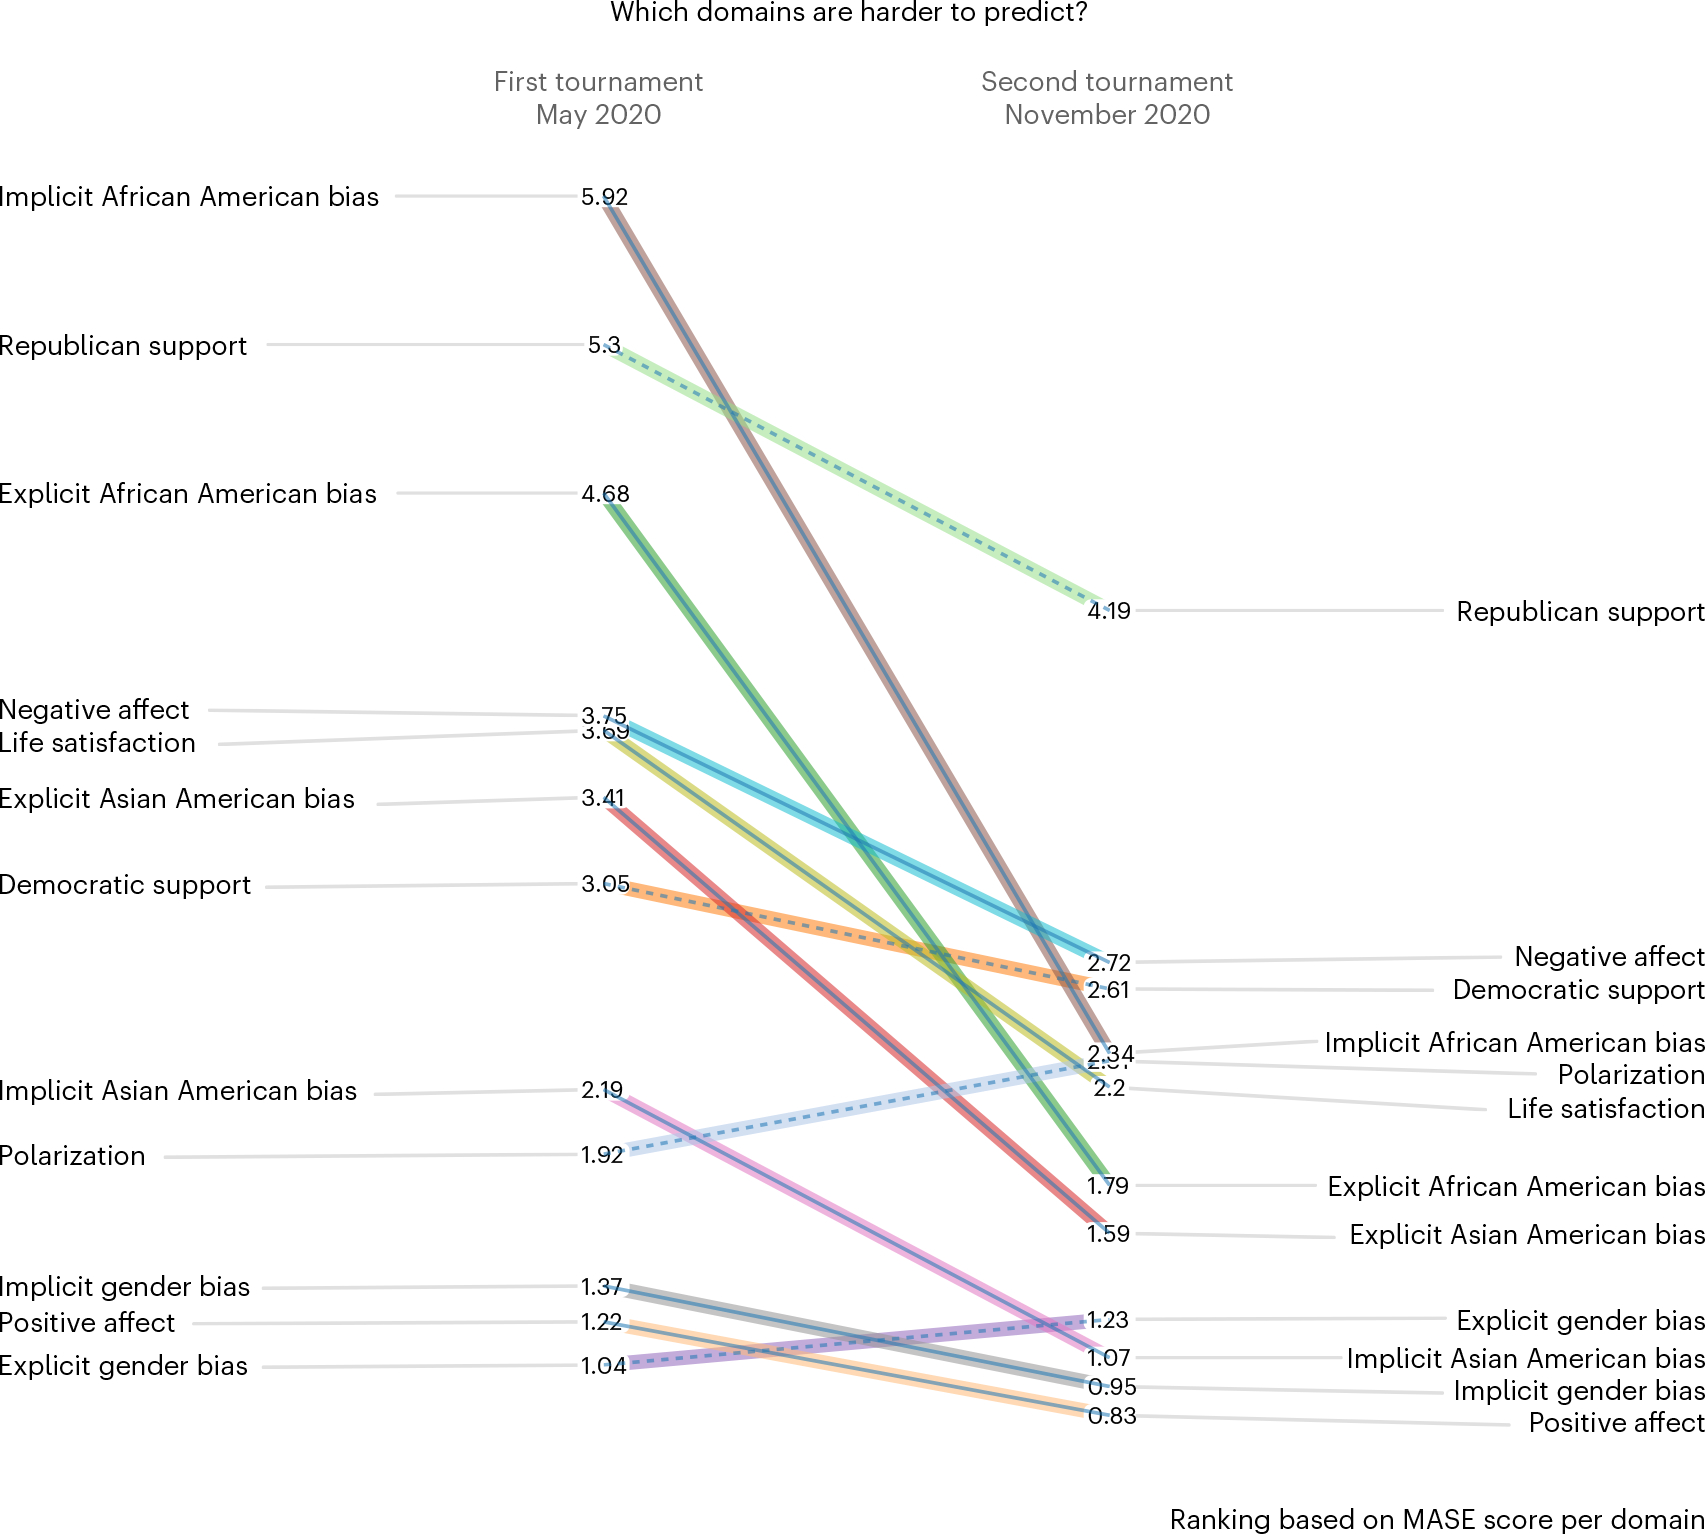
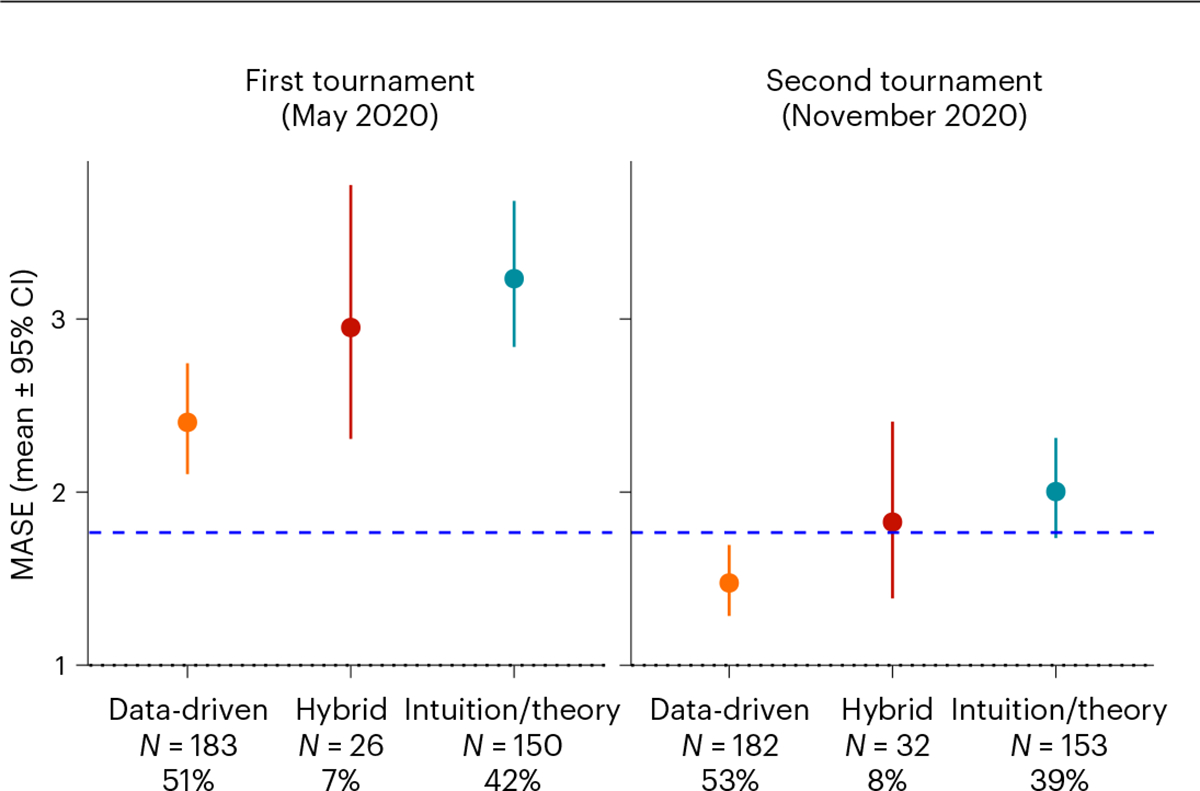
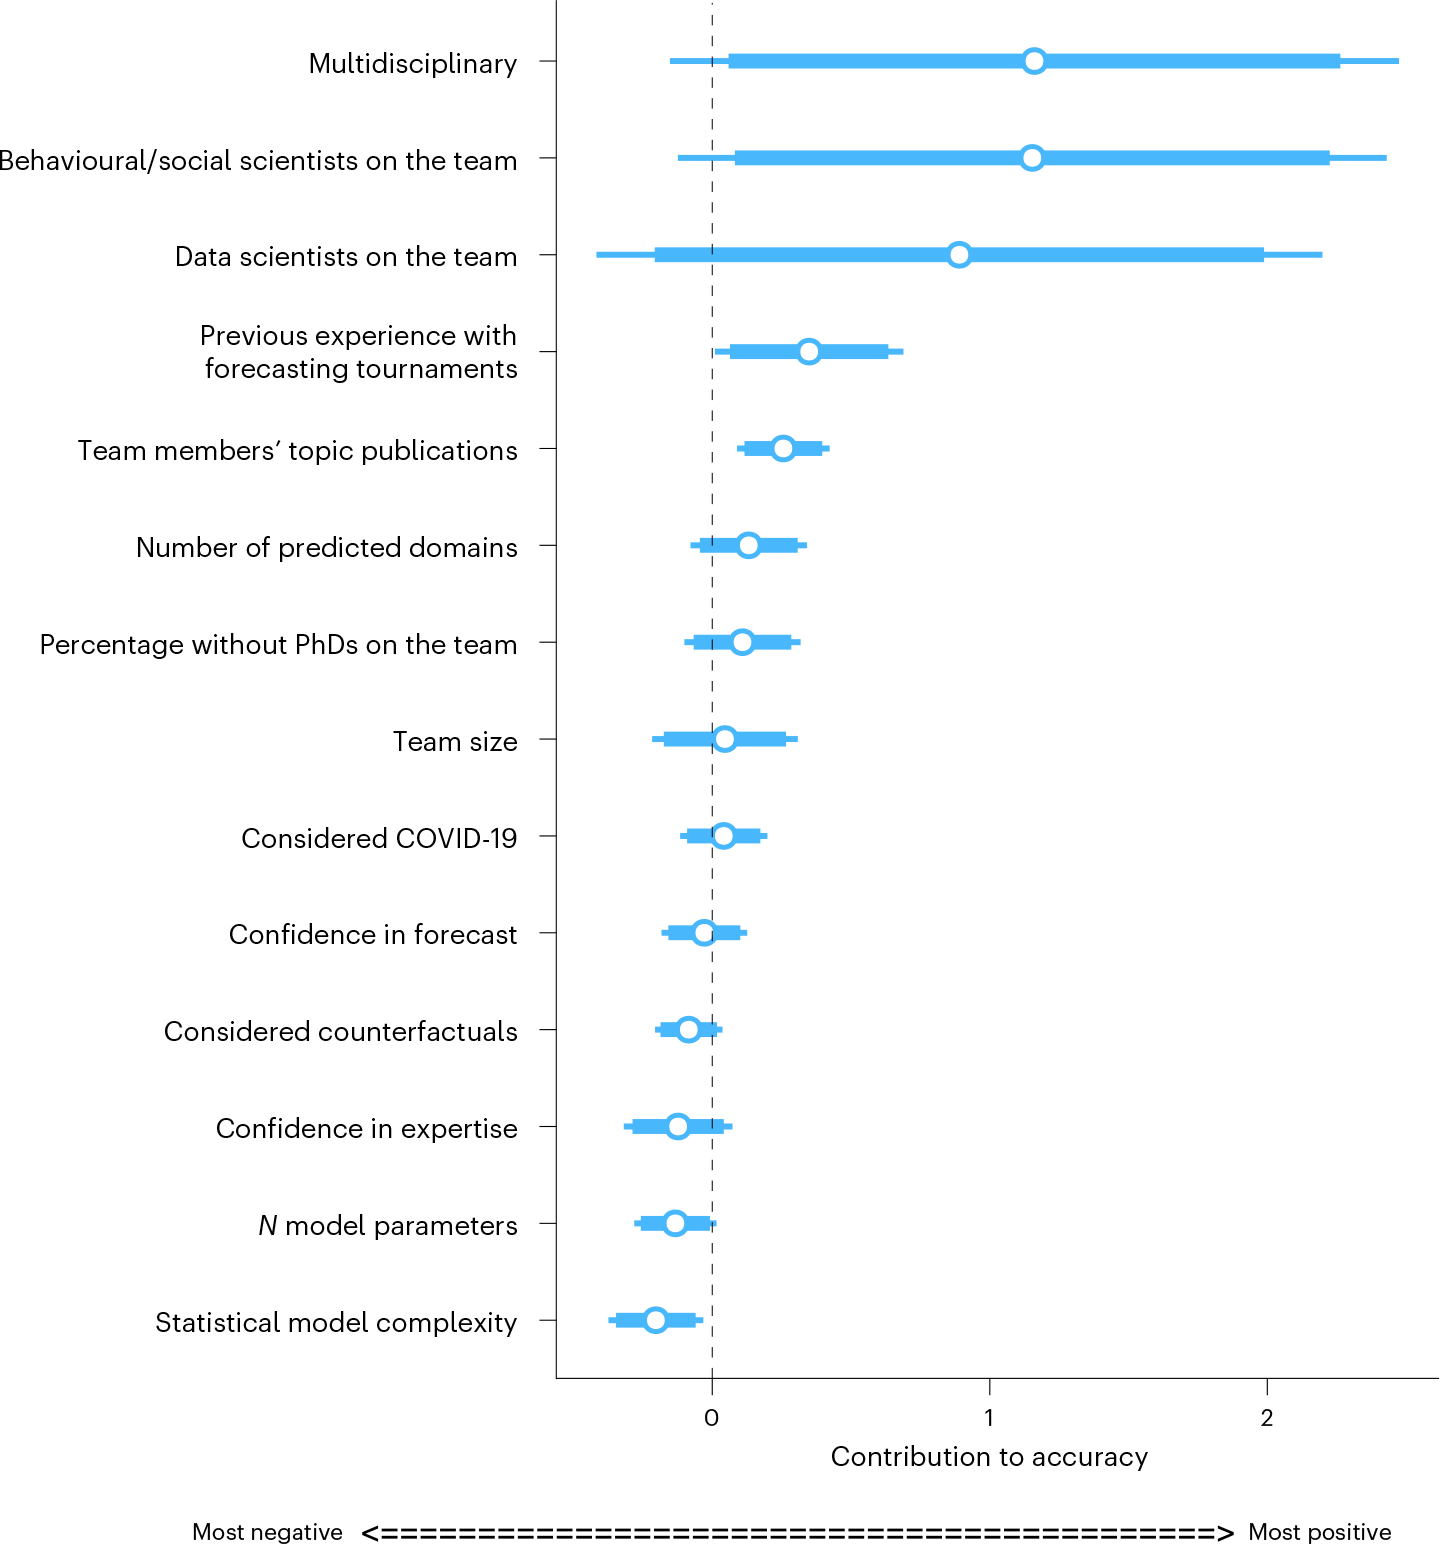
How well can social scientists predict societal change, and what processes underlie their predictions? To answer these questions, we ran two forecasting tournaments testing the accuracy of predictions of societal change in domains commonly studied in the social sciences: ideological preferences, political polarization, life satisfaction, sentiment on social media, and gender-career and racial bias. After we provided them with historical trend data on the relevant domain, social scientists submitted pre-registered monthly forecasts for a year (Tournament 1; N = 86 teams and 359 forecasts), with an opportunity to update forecasts on the basis of new data six months later (Tournament 2; N = 120 teams and 546 forecasts). Benchmarking forecasting accuracy revealed that social scientists' forecasts were on average no more accurate than those of simple statistical models (historical means, random walks or linear regressions) or the aggregate forecasts of a sample from the general public (N = 802). However, scientists were more accurate if they had scientific expertise in a prediction domain, were interdisciplinary, used simpler models and based predictions on prior data.


Conflict of interest statement

Competing interests

The authors declare no competing interests.

Figures

Fig. 1 |
Fig. 1 |. Social scientists’ average forecasting errors, compared against different benchmarks.
We ranked the domains from least to most error in Tournament 1, assessing forecasting errors via the MASE. The estimated means for the scientists and the naive crowd indicate the fixed-effect coefficients of a linear mixed model with domain (k = 12) and group (in Tournament 1: Nscientists = 86, Nnaive crowd = 802; only scientists in Tournament 2: N = 120) as predictors of forecasting error (MASE) scores nested in teams (Tournament 1 observations: Nscientists = 359, Nnaive crowd = 1,467; Tournament 2 observations: N = 546), using restricted maximum likelihood estimation. To correct for right skew, we used log-transformed MASE scores, which were subsequently back-transformed when calculating estimated means and 95% CIs. In each tournament, the CIs were adjusted for simultaneous inference of estimates for 12 domains in each tournament by simulating a multivariate t distribution. The benchmarks represent the naive crowd and the best-performing naive statistical benchmark (historical mean, average random walk with an autoregressive lag of one or linear regression). Statistical benchmarks were obtained via simulations (k = 10,000) with resampling (Supplementary Information). Scores to the left of the dotted vertical line show better performance than a naive in-sample random walk. Scores to the left of the dashed vertical line show better performance than the median performance in M4 tournaments.
Fig. 2 |
Fig. 2 |. Forecasts and ground truth—are forecasts anchoring on the last few historical data points?
Historical time series (40 months before Tournament 1) and ground truth series (12 months over Tournament 1), along with forecasts of individual teams (light blue), lowess curves and 95% CIs across social scientists’ forecasts (blue), and lowess curves and 95% CIs across the naive crowd’s forecasts (salmon). For most domains, Tournament 1 forecasts of both scientists and the naive crowd start near the last few historical data points they received prior to the tournament (January–March 2020). Note that the April 2020 forecast was not individual teams (light blue), lowess curves and 95% CIs across social scientists’ provided to the participants. IAT, implicit association test.
Fig. 3 |
Fig. 3 |. Ratios of forecasting errors among benchmarks compared to scientific forecasts.
Scores greater than 1 indicate greater accuracy of scientific forecasts. Scores less than 1 indicate greater accuracy of naive benchmarks. The domains are ranked from least to most error among scientific teams in Tournament 1. The estimated means indicate the fixed-effect coefficients of linear mixed models with domain (k = 12) in each tournament (NTournament 1 = 86; NTournament 2 = 120) as a predictor of benchmark-specific ratio scores nested in teams (observations: NTournament 1 = 359, NTournament 2 = 546), using restricted maximum likelihood estimation. To correct for right skew, we used square-root or log-transformed MASE scores, which were subsequently back-transformed when calculating estimated means and 95% CIs. The CIs were adjusted for simultaneous inference of estimates for 12 domains in each tournament by simulating a multivariate t distribution.
Fig. 4 |
Fig. 4 |. Cross-tournament consistency in the ranking of domains in terms of forecasting inaccuracy.
Cross-tournament consistency in the ranking of domains in terms of forecasting inaccuracy. Left part of the graph shows ranking of domains in terms of the estimated mean forecasting error, assessed via MASE, across all teams in the first tournament (May 2020) from most to least inaccurate. Right part of the graph shows corresponding ranking of domains for the second tournament (November 2020). A solid line of the slope graph indicates that the change in accuracy between tournaments is statistically significant (P < 0.05); a dashed line indicates a non-significant change. Significance was determined via pairwise comparisons of log(MASE) scores for each domain, drawing on the restricted information maximum likelihood model with tournament (first or second), domain and their interaction as predictors of the log(MASE) scores, with responses nested in scientific teams (Nteams = 120, Nobservations = 905).
Fig. 5 |
Fig. 5 |. Forecasting errors by prediction approach.
The estimated means and 95% CIs are based on a restricted information maximum likelihood linear mixed-effects model with model type (data-driven, hybrid or intuition/theory-based) as a fixed-effects predictor of the log(MASE) scores, domain as a fixed-effects covariate and responses nested in participants. We ran separate models for each tournament (first: Ngroups = 86, Nobservations = 359; second: Ngroups = 120, Nobservations = 546). Scores below the dotted horizontal line show better performance than a naive in-sample random walk. Scores below the dashed horizontal line show better performance than the median performance in M4 tournaments.
Fig. 6 |
Fig. 6 |. Contributions of specific forecasting strategies and team characteristics to forecasting accuracy.
Contributions of specific forecasting strategies (n parameters, statistical model complexity, consideration of exogenous events and counterfactuals) and team characteristics to forecasting accuracy (reversed MASE scores), ranked in terms of magnitude. Scores to the right of the dashed vertical line contribute positively to accuracy, whereas estimates to the left of the dashed vertical line contribute negatively. The analyses control for domain type. All continuous predictors are mean-centred and scaled by two standard deviations, to afford comparability. The reported standard errors are heteroskedasticity robust. The thicker bands show the 90% CIs, and the thinner lines show the 95% CIs. The effects are statistically significant if the 95% CI does not include zero (dashed vertical line).

Comment in

  • Predicting the future of society.
    Salganik MJ. Salganik MJ. Nat Hum Behav. 2023 Apr;7(4):478-479. doi: 10.1038/s41562-023-01535-7. Nat Hum Behav. 2023. PMID: 36759587 No abstract available.

References

    1. Hutcherson C et al. On the accuracy, media representation, and public perception of psychological scientists’ judgments of societal change. Preprint at 10.31234/osf.io/g8f9s (2023). - DOI - PubMed
    1. Collins H & Evans R Rethinking Expertise (Univ. of Chicago Press, 2009).
    1. Fama EF Efficient capital markets: a review of theory and empirical work. J. Finance 25, 383–417 (1970).
    1. Tetlock PE Expert Political Judgement: How Good Is It? (Princeton University Press, 2017).
    1. Hofman JM et al. Integrating explanation and prediction in computational social science. Nature 595, 181–188 (2021). - PubMed

Publication types