Clinical Trial
. 2019 Sep 19;4(18):e130664.
doi: 10.1172/jci.insight.130664.

Adoptive lymphocyte transfer to an HIV-infected progressor from an elite controller

Affiliations
Clinical Trial

Adoptive lymphocyte transfer to an HIV-infected progressor from an elite controller

Stephen A Migueles et al. JCI Insight. .

Abstract

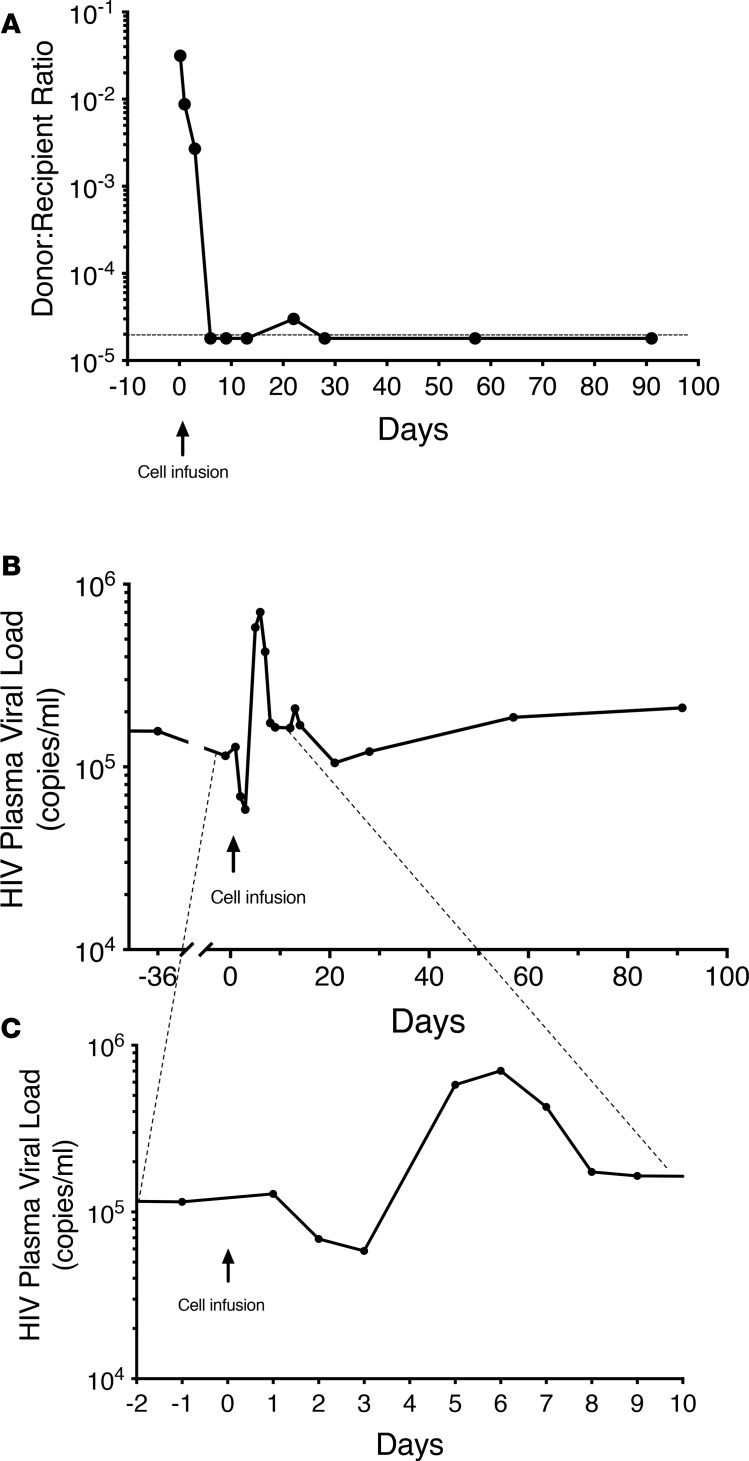
BACKGROUNDHIV-infected patients with poor virologic control and multidrug-resistant virus have limited therapeutic options. The current study was undertaken to evaluate the safety, immunologic effects, and antiviral activity of peripheral lymphocytes transferred from an elite controller, whose immune system is able to control viral replication without antiretroviral medications, to an HLA-B*2705-matched progressor.METHODSApproximately 22 billion cells were collected from an elite controller by lymphapheresis and infused within 6 hours into a recipient with a preinfusion CD4+ T cell count of 10 cells/μL (1%) and HIV plasma viral load of 114,993 copies/mL.RESULTSDonor cells were cleared from the recipient's peripheral blood by day 8. A transient decrease in viral load to 58,421 (day 3) was followed by a rebound to 702,972 (day 6) before returning to baseline values by day 8. The decreased viral load was temporally associated with peak levels of donor T cells, including CD8+ T cells that had high levels of expression of Ki67, perforin, and granzyme B. Notably, recipient CD8+ T cells also showed increased expression of these markers, especially in HIV-specific tetramer-positive cells.CONCLUSIONThese results suggest that the adoptive transfer of lymphocytes from an HIV-infected elite controller to an HIV-infected patient with progressive disease may be able to perturb the immune system of the recipient in both positive and negative ways.TRIAL REGISTRATIONClinicalTrials.gov NCT00559416.FUNDINGIntramural Research Programs of the US NIH Clinical Center and the National Institute of Allergy and Infectious Diseases (NIAID); the National Cancer Institute.

Keywords: AIDS/HIV; Adaptive immunity; Immunotherapy; Infectious disease; T cells.


Conflict of interest statement

Conflict of interest: SAM, HCL, and JAK are investigators on a clinical trial of pembrolizumab being conducted under a Cooperative Research and Development Agreement between the NIH and Merck Sharp & Dohme Corp.

Figures

Figure 1
Figure 1. Donor and recipient pretransfer PBMCs shared the immunodominant B27-restricted HIV Gag KK10–specific CD8+ T cell response that was highly functional in the donor and maintained recognition of recipient viral variant sequences.
(A) Representative flow plots gated on donor (top row) and recipient (bottom row) CD8+ T cells after 6-hour incubation with medium alone (unstimulated, left column) or a pool of Gag 15-mer peptides (right column) in the presence of Golgi inhibitors and the anti-CD107a PE-Cy7–labeled monoclonal antibody before surface and intracellular staining and flow cytometric analysis (see Methods). Red numbers indicate net frequencies of IFN-γ+ and/or CD107a+CD8+ T cells after background subtraction. (B) Summary of donor and recipient IFN-γ+ and/or CD107a+CD8+ T cell responses determined as in A to overlapping peptide pools spanning HIV-1 Env (shown in blue), Nef (shown in red), Gag (shown in black), and Pol (shown in green) gene products. Background responses to medium have been subtracted. (C) The majority of donor (top plot) and recipient (bottom plot) CD8+ T cells responding to Gag by producing IFN-γ and/or expressing CD107a stain positively with the B27/HIV Gag KK10 tetramer. (D) A greater fraction of donor (top plot) versus recipient (bottom plot) B27/HIV Gag KK10 tetramer–positive CD8+ T cells are functional based on the capacity to produce IFN-γ and/or express CD107a. (E) Donor (top row) and recipient (bottom row) IFN-γ+CD8+ T cells are shown in response to autologous PBMCs pulsed with consensus sequence KK10 (left column) or a peptide containing the R264Q and L268M sequence variations harbored within the recipient’s autologous virus (right column). (F) The percentages of total donor IFN-γ+ and/or CD107a+CD8+ T cells in response to recipient uninfected (left column) or HIV-infected (right column) targets (top row). Percentages of donor tetramer–positive and tetramer–negative CD8+ T cells expressing CD107a after stimulation with the same targets are shown in the bottom row. Black numbers on plots represent percentages of gated cells. (G) Summary of donor or recipient CD8+ T cell cytotoxic responses to autologous or heterologous uninfected or HIV-infected CD4+ T cell targets is shown. Cytotoxicity was measured by flow cytometry based on granzyme B activity in targets following a 1-hour incubation with CD8+ T cell effectors. The HIV isolate used to infect all targets was recovered from recipient CD4+ T cells.
Figure 2
Figure 2. Levels of donor cells and plasma HIV over time following infusion of ~15 billion donor lymphocytes (~22 billion total cells).
(A) Ratio of donor to recipient cells, as determined by quantitative PCR, over time. There was a rapid loss of donor cells so that by day 6 donor cells were at or below the level of detection. The y axis shows the ratio of donor to recipient cells and uses a log scale. (B and C) Changes in HIV plasma viral levels over time. The y axis in both panels shows plasma HIV levels using a log scale. C is an expansion of the timeline shown in B to demonstrate the changes seen in the immediate after-infusion period. There was a transient decline in viral load immediately following the infusion that was temporally associated with detectable transferred cells, following which there was a viral rebound before a return to baseline levels. The time of cell infusion is indicated by the arrow.
Figure 3
Figure 3. Changes in CD4+ and CD8+ T cell numbers over time following the cell infusion.
There was a transient decrease in both CD4+ and CD8+ T cell numbers immediately after the infusion, followed by an increase in both populations, though the absolute increase in CD4+ T cell numbers was modest (~10 cells/μL). CD4+ and CD8+ cell numbers are shown by the black circles and lines. HIV plasma viral load during the same period is indicated by the blue squares and lines. The time of cell infusion is indicated by the arrow.
Figure 4
Figure 4. Changes in plasma levels of select cytokines over time following the cell infusion.
Transient increases in IFN-γ, IL-2, IL-10, TNF-α, and CXCL10 were seen immediately following the infusion, before a return to baseline levels. The time of cell infusion is indicated by the arrow.
Figure 5
Figure 5. Donor and recipient cells could be distinguished in recipient blood by flow cytometric detection with anti–HLA-A2 monoclonal antibody staining.
(A) Representative flow plots depict how donor (HLA-A2) and recipient (HLA-A2+) T cells were enumerated by flow cytometry. CD3+ lymphocytes were gated on CD8+ (top row) or CD8 cells (approximately representative of CD4+ cells; bottom row) in recipient samples taken before day –1 (left column) or after days 1–9 (right columns) adoptive transfer. (B) Summary of donor-derived CD3+CD8+ (solid black line), CD3+CD8 (dotted black line), CD3CD8+ (solid gray line), and CD3CD8 (dotted gray line) lymphocytes after adoptive transfer through day 90 are shown. (C) Donor (HLA-A2) immunodominant CD8+ T cells specific for the HLA-B27–restricted HIV-1 Gag epitope KK10 were detected until day 3 after transfer. The pretransfer cells from the donor are shown in the first panel, while the donor cells in the recipient from days 1 and 3 after transfer are shown in the next 2 panels. Gating was on CD3+HLA-A2 cells; only the CD8+ cells are shown. The numbers within the flow plots in A and C indicate the percentage of cells within the boxed areas.
Figure 6
Figure 6. Donor and recipient total and HIV-specific CD8+ T cells became more effector like and exhibited increased cycling and cytotoxic protein expression after transfer that were temporally associated with reductions in plasma HIV RNA levels.
(A) Changes in the percentages of CCR7CD27+ total (solid lines) or HLA-B27/Gag tetramer–positive (dotted lines) CD8+ T cells from the recipient (blue triangles) and donor (red triangles) are shown before and days after adoptive transfer. (B) Ki67 expression of total (solid lines) or HLA-B27/Gag tetramer+ (dotted lines) CD8+ T cells from the recipient (blue diamonds) and donor (red diamonds) are shown at the same time points around adoptive transfer. (C) Representative flow plots of perforin (left plots) and granzyme B (right plots) expression of gated donor (top row) and recipient (bottom row) total CD8+ T cells before transfer and day 3 after transfer. (D and E) Summary data of perforin (D, circles) and granzyme B (E, squares) expression in total (solid lines) or HLA-B27/Gag tetramer–positive (dotted lines) CD8+ T cells from the donor (red symbols) and recipient (blue symbols) are shown over time. In all panels, pretransfer donor values were derived from cells obtained from the donor; all other values were derived from cells obtained from the recipient before or after transfer.
Figure 7
Figure 7. Phenotype of donor and recipient CD4+ T cells changed after transfer, then reverted back to baseline.
(A) Gated on CD4+ (CD8) T cells, donor (HLA-A2) cells (top row), which were primarily CCR7+CD27+ before transfer (left column), were predominantly CCR7CD27 on day 1 before reverting to a CCR7+CD27+ phenotype by day 3 (right columns). In contrast, recipient (HLA-A2+) cells (bottom row), which were primarily CCR7CD27+ before transfer (left column), were predominantly CCR7+CD27+ on day 1 before reversion to a CCR7CD27+ phenotype (right columns). (B) Trends of recipient (blue symbols) and donor (red symbols) CCR7+CD27+CD4+ T cells over time. (C) Ki67 expression of gated recipient (blue symbols) and donor (red symbols) CD4+ (CD8) T cells over time. In all panels, pretransfer donor results were derived from cells obtained from the donor; all other results were derived from cells obtained from the recipient before or after transfer.

References

    1. Palella FJ, Jr, et al. Declining morbidity and mortality among patients with advanced human immunodeficiency virus infection. HIV Outpatient Study Investigators. N Engl J Med. 1998;338(13):853–860. doi: 10.1056/NEJM199803263381301. - DOI - PubMed
    1. Kitahata MM, et al. Effect of early versus deferred antiretroviral therapy for HIV on survival. N Engl J Med. 2009;360(18):1815–1826. doi: 10.1056/NEJMoa0807252. - DOI - PMC - PubMed
    1. INSIGHT START Study Group. et al. Initiation of antiretroviral therapy in early asymptomatic HIV infection. N Engl J Med. 2015;373(9):795–807. doi: 10.1056/NEJMoa1506816. - DOI - PMC - PubMed
    1. Coffin JM. HIV population dynamics in vivo: implications for genetic variation, pathogenesis, and therapy. Science. 1995;267(5197):483–489. doi: 10.1126/science.7824947. - DOI - PubMed
    1. Margolis AM, Heverling H, Pham PA, Stolbach A. A review of the toxicity of HIV medications. J Med Toxicol. 2014;10(1):26–39. doi: 10.1007/s13181-013-0325-8. - DOI - PMC - PubMed

Publication types

MeSH terms

Associated data