. 2023 Jun 22:10:1180769.
doi: 10.3389/fmed.2023.1180769. eCollection 2023.

Torque teno virus viremia and QuantiFERON®-CMV assay in prediction of cytomegalovirus reactivation in R+ kidney transplant recipients

Affiliations

Torque teno virus viremia and QuantiFERON®-CMV assay in prediction of cytomegalovirus reactivation in R+ kidney transplant recipients

Sarah Mafi et al. Front Med (Lausanne). .

Abstract

Introduction: Cytomegalovirus (CMV) is the most frequent infectious complication following solid organ transplantation. Torque teno viruses (TTV) viremia has been proposed as a biomarker of functional immunity in the management of kidney transplant recipients (KTR). The QuantiFERON®-CMV (QF-CMV) is a commercially available assay that allows the assessment of CD8+ T-cell responses in routine diagnostic laboratories.

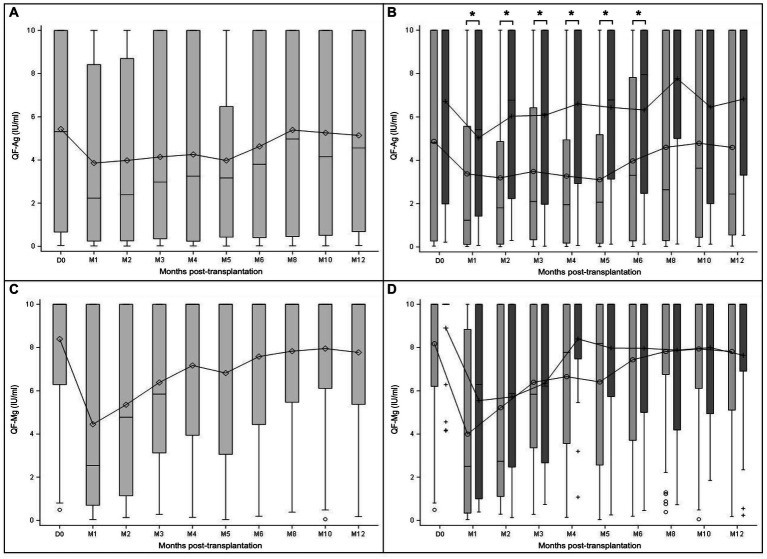
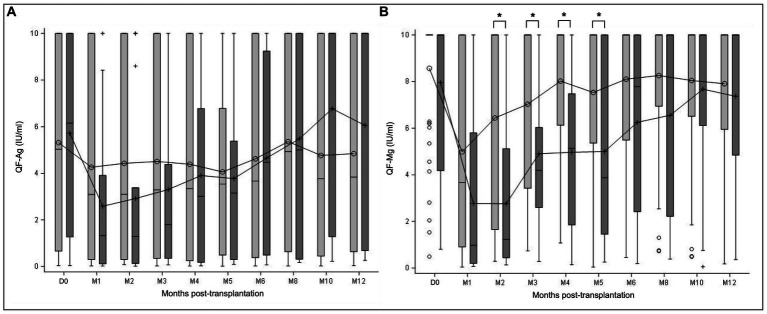
Methods: In a prospective national multicenter cohort of 64 CMV-seropositive (R+) KTR, we analyzed the value of TTV load and the two markers of the QF-CMV assay [QF-Ag (CMV-specific T-cell responses) and QF-Mg (overall T-cell responses)], alone and in combination, in prediction of CMV reactivation (≥3 log10 IU/ ml) in the first post-transplant year. We compared previously published cut-offs and specific cut-offs optimized from ROC curves for our population.

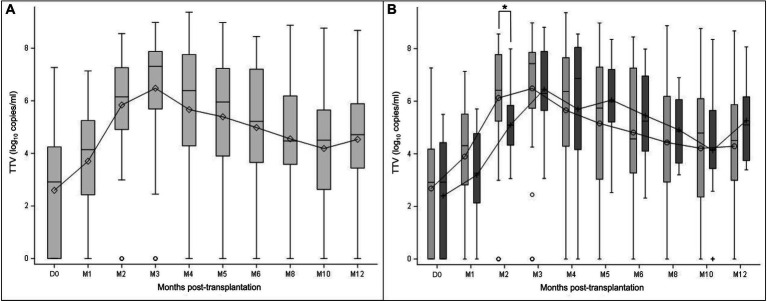
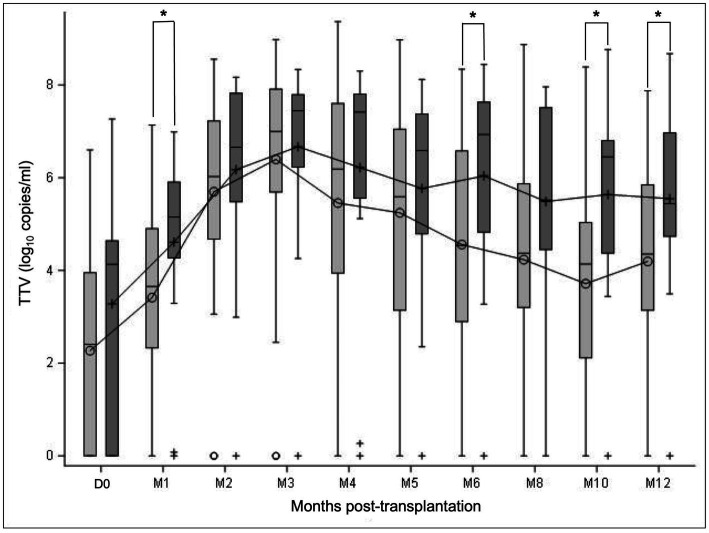
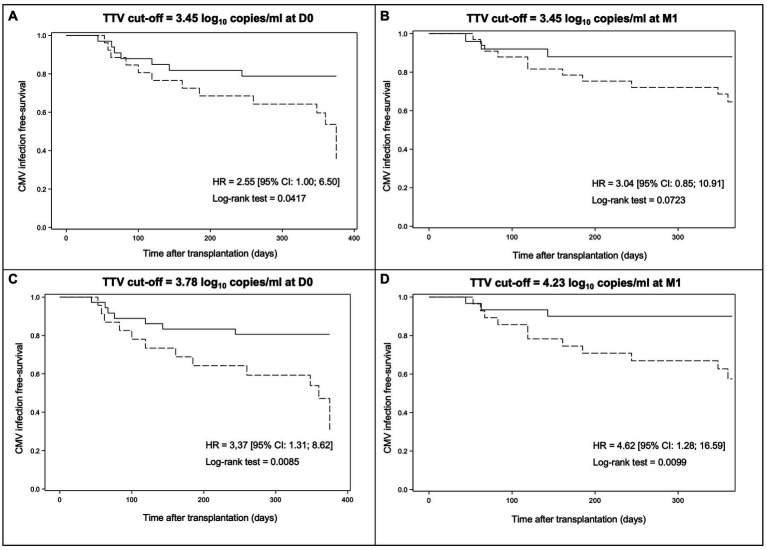
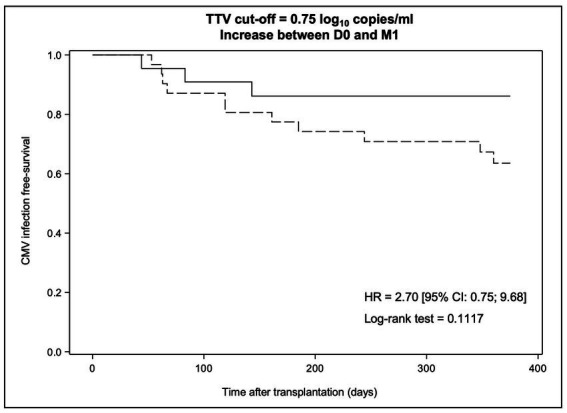
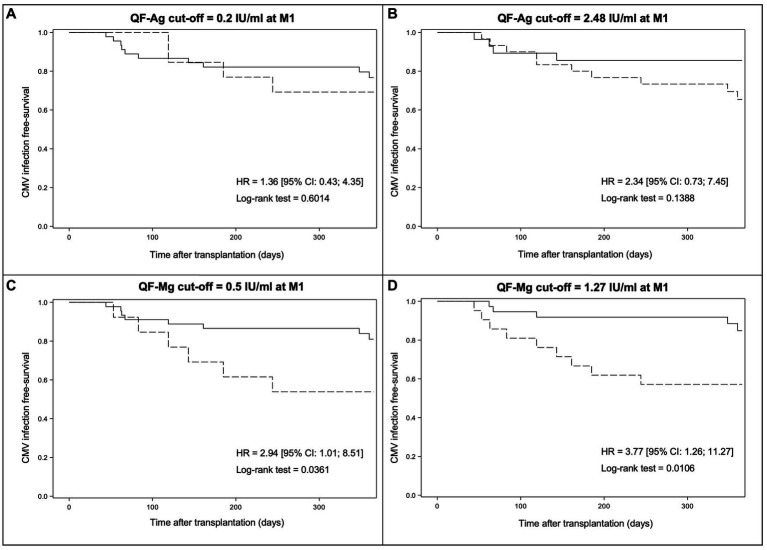
Results: Using the conventional cut-off (3.45 log10 copies/ml), TTV load at D0 [inclusion visit on the day of transplantation before induction (D0)], or at M1 (1-month post-transplant visit) perform better in predicting CMV viremia control than CMV reactivation. Survival analyses suggest a better performance of our optimized TTV cut-offs (3.78 log10 copies/ml at D0 and 4.23 log10 copies/ml at M1) for risk stratification of CMV reactivation in our R+ KTR cohort. The QF-CMV (QF-Ag = 0.2 IU/ml, and QF-Mg = 0.5 IU/ml) also appears to better predict CMV viremia control than CMV reactivation. Moreover, survival analyses suggest that the QF-Mg would perform better than the QF-Ag in stratifying the risk of CMV reactivation. The use of our optimized QF-Mg cut-off (1.27 IU/ml) at M1 further improved risk stratification of CMV reactivation. Using conventional cut-offs, the combination of TTV load and QF-Ag or TTV load and QF-Mg did not improve prediction of CMV viremia control compared to separate analysis of each marker but resulted in an increase of positive predictive values. The use of our cut-offs slightly improved risk prediction of CMV reactivation.

Conclusion: The combination of TTV load and QF-Ag or TTV load and QF-Mg could be useful in stratifying the risk of CMV reactivation in R+ KTR during the first post-transplant year and thereby have an impact on the duration of prophylaxis in these patients.

Clinical trial registration: ClinicalTrials.gov registry, identifier NCT02064699.

Keywords: CMV-seropositive recipients; QuantiFERON® CMV; Torquetenovirus; cytomegalovirus; kidney transplantation.


Conflict of interest statement

The authors declare that the research was conducted in the absence of any commercial or financial relationships that could be construed as a potential conflict of interest.

Figures

Figure 1
Figure 1
TTV load dynamics measured at transplantation (D0) and at month (M) 1, 2, 3, 4, 5, 6, 8, 10, and 12 after transplantation. The results are presented in the overall study population (A), and in the subgroups of patients with (light grey) and without prophylaxis (dark grey) at D0 (B). Mean values are displayed on the graph as points. Median values are represented by bars, and the interquartile range is represented by boxes. Significant differences are represented in the figure by an asterisk (p < 0.05).
Figure 2
Figure 2
TTV load dynamics of all R+ KTR according to CMV reactivation. TTV load was measured at transplantation (D0) and at month (M) 1, 2, 3, 4, 5, 6, 8, 10, and 12 after transplantation. TTV kinetics are presented in the subgroups of patients with CMV reactivation ≥3 log10 IU/ml (dark grey) and without CMV reactivation (light gray) in the year post-transplant. Mean values are displayed on the graph as points. Median values are represented by bars, and the interquartile range is represented by boxes. Significant differences are represented in the figure by an asterisk (p < 0.05).
Figure 3
Figure 3
Kaplan–Meier survival curves modelling freedom from CMV reactivation through day + 360 post-transplant according to the result of TTV load at D0 or M1. The results are presented according to the TTV cut-off of 3.45 log10 copies/ml at D0 (A), the TTV cut-off of 3.45 log10 copies/ml at M1 (B), the optimal TTV cut-off at D0 determined by ROC curves (3.78 log10 copies/ml) (C), and the optimal TTV cut-off at M1 as defined by ROC curves (4.23 log10 copies/ml) (D). Dotted lines indicate TTV load above the cut-off while solid lines indicate TTV load below the cut-off. HR, hazard ratio and CI, confidence interval.
Figure 4
Figure 4
Kaplan–Meier survival curves modelling freedom from CMV reactivation through day + 360 post-transplant according to the dynamic change in TTV levels between D0 and M1. The dotted line indicates an increase in TTV levels >0.75 log10 copies/ml while the solid line indicates a TTV dynamic change below this value. HR, hazard ratio and CI, confidence interval.
Figure 5
Figure 5
QF-CMV assay dynamics measured at transplantation (D0) and at month (M) 1, 2, 3, 4, 5, 6, 8, 10, and 12 after transplantation. The results are presented separately for the QF-Ag and the QF-Mg in the overall study population (A,C), and in the subgroups of patients with (light grey) and without prophylaxis (dark grey) at D0 (B,D). Mean values are displayed on the graph as points. Median values are represented by bars, and the interquartile range is represented by boxes. Significant differences are represented in the figure by an asterisk (p < 0.05).
Figure 6
Figure 6
QF-CMV assay dynamics of all R+ KTR according to CMV reactivation. QF-assay was measured at transplantation (D0) and at month (M) 1, 2, 3, 4, 5, 6, 8, 10, and 12 after transplantation. QF-Ag (A) and QF-Mg (B) kinetics are presented in the subgroups of patients with CMV reactivation ≥3 log10 IU/ml (dark grey) and without CMV reactivation (light grey), as measured in the year post-transplant. Mean values are displayed on the graph as points. Median values are represented by bars, and the interquartile range is represented by boxes. Significant differences are represented in the figure by an asterisk (p < 0.05).
Figure 7
Figure 7
Kaplan–Meier survival curves modelling freedom from CMV reactivation from M1 to M12 according to the result of the QF-CMV at M1. The results are presented for the manufacturer’s QF-Ag cut-off (A), the optimal QF-Ag cut-off determined by ROC curves (B), the manufacturer’s QF-Mg cut-off (C), and the optimal QF-Mg cut-off determined by ROC curves (D). Solid lines indicate QF-CMV results above the cut-off while dotted lines indicate QF-CMV results below the cut-off. HR, hazard ratio and CI, confidence interval.

References

    1. Razonable RR, Humar A. Cytomegalovirus in solid organ transplant recipients-guidelines of the American Society of transplantation infectious diseases community of practice. Clin Transpl. (2019) 33:e13512. doi: 10.1111/ctr.13512, PMID: - DOI - PubMed
    1. Humar A, Snydman D. AST infectious diseases community of practice. Cytomegalovirus in solid organ transplant recipients. Am J Transplant. (2009) 9:S78–86. doi: 10.1111/j.1600-6143.2009.02897.x - DOI - PubMed
    1. Kotton CN, Kumar D, Caliendo AM, Huprikar S, Chou S, Danziger-Isakov L, et al. . The third international consensus guidelines on the management of cytomegalovirus in solid-organ transplantation. Transplantation. (2018) 102:900–31. doi: 10.1097/TP.0000000000002191, PMID: - DOI - PubMed
    1. Razonable R. Direct and indirect effects of cytomegalovirus: can we prevent them? Enferm Infecc Microbiol Clin. (2010) 28:1–5. doi: 10.1016/j.eimc.2009.07.008 - DOI - PubMed
    1. Ramanan P, Razonable RR. Cytomegalovirus infections in solid organ transplantation: a review. Infect Chemother. (2013) 45:260–71. doi: 10.3947/ic.2013.45.3.260, PMID: - DOI - PMC - PubMed

Associated data