

Effects of neurally adjusted ventilatory assist on air distribution and dead space in patients with acute exacerbation of chronic obstructive pulmonary disease
- PMID: 28578708
- PMCID: PMC5455203
- DOI: 10.1186/s13054-017-1714-1
Effects of neurally adjusted ventilatory assist on air distribution and dead space in patients with acute exacerbation of chronic obstructive pulmonary disease
Abstract
Background: Neurally adjusted ventilatory assist (NAVA) could improve patient-ventilator interaction; its effects on ventilation distribution and dead space are still unknown. The aim of this study was to evaluate the effects of varying levels of assist during NAVA and pressure support ventilation (PSV) on ventilation distribution and dead space in patients with acute exacerbation of chronic obstructive pulmonary disease (AECOPD).
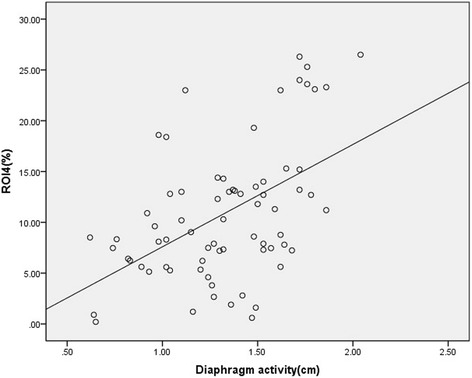
Methods: Fifteen mechanically ventilated patients with AECOPD were included in the study. The initial PSV levels were set to 10 cmH2O for 10 min. Thereafter, the ventilator mode was changed to NAVA for another 10 min with the same electrical activity of the diaphragm as during PSV. Furthermore, the ventilation mode was switched between PSV and NAVA every 10 min in the following order: PSV 5 cmH2O; NAVA 50%; PSV 15 cmH2O; and NAVA 150% (relative to the initial NAVA support level). Ventilation distribution in the lung was evaluated in percentages in regions of interest (ROI) of four anteroposterior segments of equal height (ROI1 to ROI4 represents ventral, mid-ventral, mid-dorsal, and dorsal, respectively). Blood gases, ventilation distribution (electrical impedance tomography), diaphragm activity (B-mode ultrasonography), and dead space fraction (PeCO2 and PaCO2) were measured.
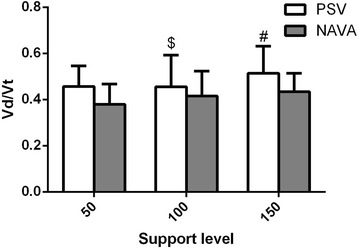
Results: The trigger and cycle delays were lower during NAVA than during PSV. The work of trigger was significantly lower during NAVA compared to PSV. The diaphragm activities based on ultrasonography were higher during NAVA compared to the same support level during PSV. The ventilation distribution in ROI4 increased significantly (P < 0.05) during NAVA compared to PSV (except for a support level of 50%). Similar results were found in ROI3 + 4. NAVA reduced dead space fraction compared to the corresponding support level of PSV.
Conclusions: NAVA was superior to PSV in AECOPD for increasing ventilation distribution in ROI4 and reducing dead space.
Trial registration: Clinicaltrials.gov, NCT02289573 . Registered on 12 November 2014.
Keywords: Electrical impedance tomography; Intratidal gas distribution; Patient-ventilator interaction; Vd/Vt; Work of trigger.
Figures


References
Publication types
MeSH terms
Associated data
LinkOut - more resources
Full Text Sources
Other Literature Sources
Medical
