Clinical Trial
. 2023 Dec 1;29(23):4784-4796.
doi: 10.1158/1078-0432.CCR-23-0235.

Randomized Phase II Trial of Dendritic Cell/Myeloma Fusion Vaccine with Lenalidomide Maintenance after Upfront Autologous Hematopoietic Cell Transplantation for Multiple Myeloma: BMT CTN 1401

Affiliations
Clinical Trial

Randomized Phase II Trial of Dendritic Cell/Myeloma Fusion Vaccine with Lenalidomide Maintenance after Upfront Autologous Hematopoietic Cell Transplantation for Multiple Myeloma: BMT CTN 1401

David J Chung et al. Clin Cancer Res. .

Erratum in

Abstract

Purpose: Vaccination with dendritic cell (DC)/multiple myeloma (MM) fusions has been shown to induce the expansion of circulating multiple myeloma-reactive lymphocytes and consolidation of clinical response following autologous hematopoietic cell transplant (auto-HCT).

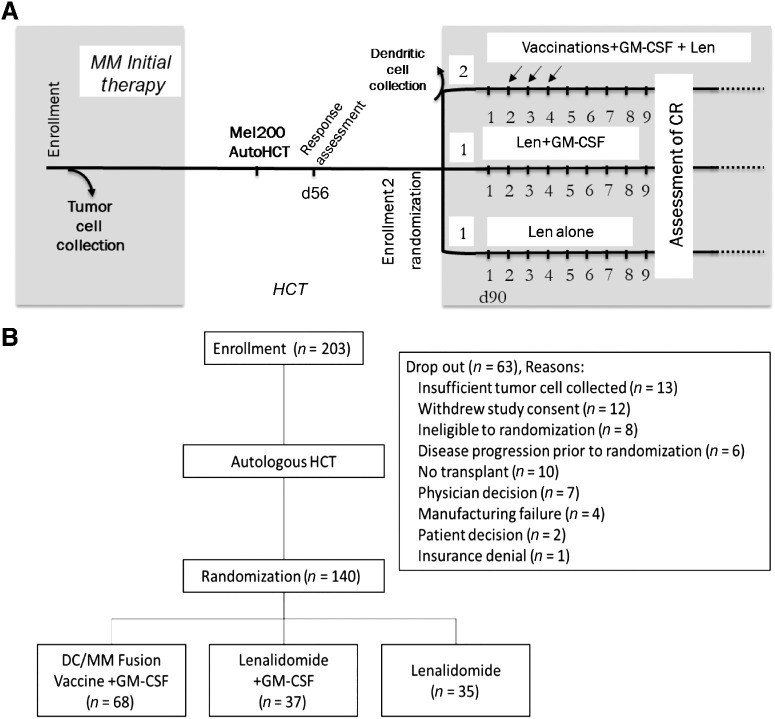
Patients and methods: In this randomized phase II trial (NCT02728102), we assessed the effect of DC/MM fusion vaccination, GM-CSF, and lenalidomide maintenance as compared with control arms of GM-CSF and lenalidomide or lenalidomide maintenance alone on clinical response rates and induction of multiple myeloma-specific immunity at 1-year posttransplant.

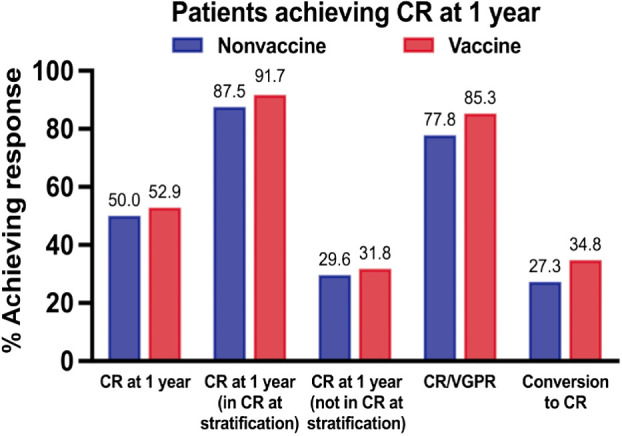
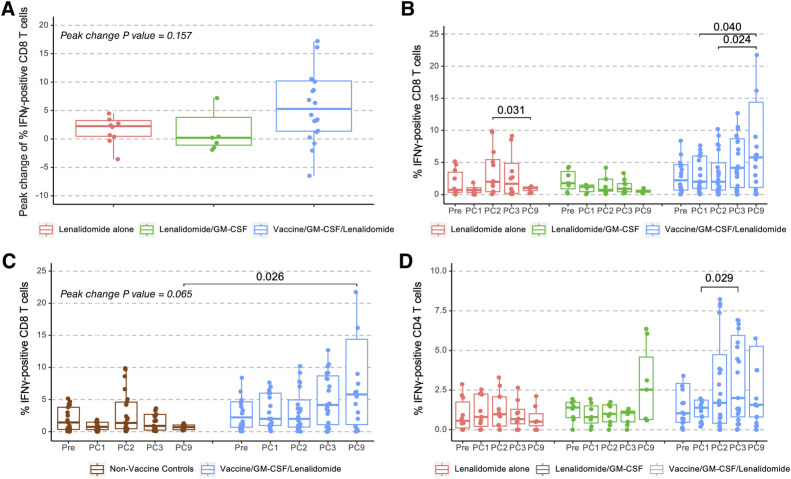
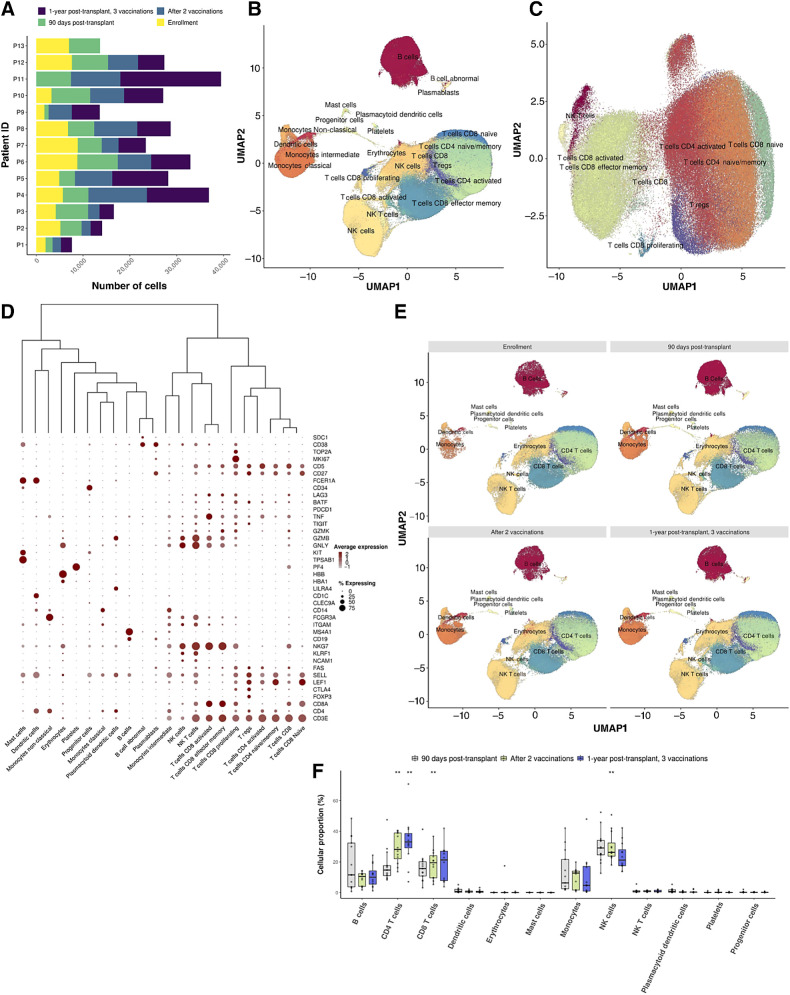
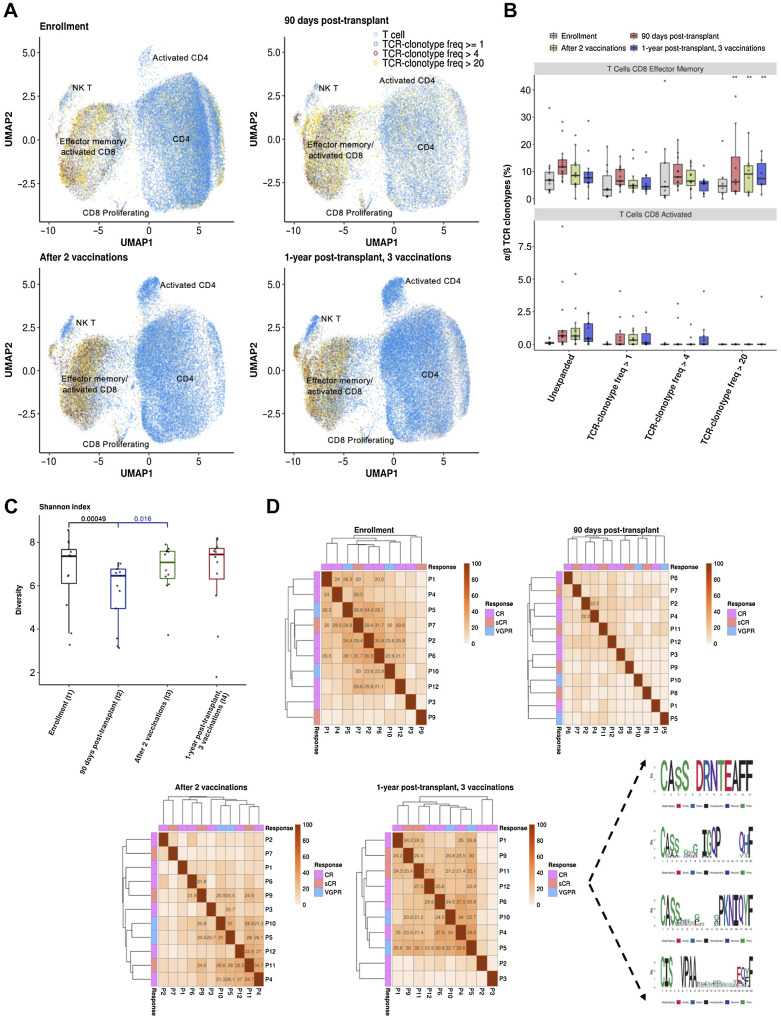
Results: The study enrolled 203 patients, with 140 randomized posttransplantation. Vaccine production was successful in 63 of 68 patients. At 1 year, rates of CR were 52.9% (vaccine) and 50% (control; P = 0.37, 80% CI 44.5%, 61.3%, and 41.6%, 58.4%, respectively), and rates of VGPR or better were 85.3% (vaccine) and 77.8% (control; P = 0.2). Conversion to CR at 1 year was 34.8% (vaccine) and 27.3% (control; P = 0.4). Vaccination induced a statistically significant expansion of multiple myeloma-reactive T cells at 1 year compared with before vaccination (P = 0.024) and in contrast to the nonvaccine arm (P = 0.026). Single-cell transcriptomics revealed clonotypic expansion of activated CD8 cells and shared dominant clonotypes between patients at 1-year posttransplant.

Conclusions: DC/MM fusion vaccination with lenalidomide did not result in a statistically significant increase in CR rates at 1 year posttransplant but was associated with a significant increase in circulating multiple myeloma-reactive lymphocytes indicative of tumor-specific immunity. Site-specific production of a personalized cell therapy with centralized product characterization was effectively accomplished in the context of a multicenter cooperative group study. See related commentary by Qazilbash and Kwak, p. 4703.


Figures

Figure 1. A, Study schema. B, CONSORT diagram.
Figure 1.
A, Study schema. B, CONSORT diagram.
Figure 2. CR rates at 1 year. Percentage of patients in the vaccine and nonvaccine arms achieving CR at 1 year based on intention-to-treat. Percentage of patients achieving CR/VGPR and conversion to CR at 1 year for those patients not achieving CR at time of posttransplant randomization is also presented.
Figure 2.
CR rates at 1 year. Percentage of patients in the vaccine and nonvaccine arms achieving CR at 1 year based on intention-to-treat. Percentage of patients achieving CR/VGPR and conversion to CR at 1 year for those patients not achieving CR at time of posttransplant randomization is also presented.
Figure 3. DC/MM fusion vaccination after auto-HCT induces the expansion of multiple myeloma–reactive T cells. PBMCs obtained at enrollment (Pre) and before lenalidomide maintenance cycles 1 (PC1), 2 (PC2, vaccine initiation time point for the vaccine arm), 3 (PC3), and 9 (PC9) exposed to autologous tumor lysate were assessed by multiparameter flow cytometry for percentage of multiple myeloma–specific T cells expressing intracellular IFNγ. A, Peak change of multiple myeloma–reactive CD8 T cells for lenalidomide control (n = 12), lenalidomide + GM-CSF control (n = 9), and vaccinated patients (lenalidomide + GM-CSF + vaccine, n = 24). B, Quantification of the multiple myeloma–reactive CD8 T cells for lenalidomide control, lenalidomide + GM-CSF control, and vaccinated patients over time. C, Quantification of the multiple myeloma–reactive CD8 T cells comparing nonvaccine controls (n = 21) with vaccinated patients (lenalidomide + GM-CSF + vaccine, n = 24) over time. D, Quantification of the multiple myeloma–reactive CD4 T cells for lenalidomide control, lenalidomide + GM-CSF control, vaccinated patients. Outliers greater than Q3+1.5IQR or less than Q1–1.5IQR are omitted from the figure. Nonsignificant P value (P > 0.05) are not shown in B and D.
Figure 3.
DC/MM fusion vaccination after auto-HCT induces the expansion of multiple myeloma–reactive T cells. PBMCs obtained at enrollment (Pre) and before lenalidomide maintenance cycles 1 (PC1), 2 (PC2, vaccine initiation time point for the vaccine arm), 3 (PC3), and 9 (PC9) exposed to autologous tumor lysate were assessed by multiparameter flow cytometry for percentage of multiple myeloma–specific T cells expressing intracellular IFNγ. A, Peak change of multiple myeloma–reactive CD8 T cells for lenalidomide control (n = 12), lenalidomide + GM-CSF control (n = 9), and vaccinated patients (lenalidomide + GM-CSF + vaccine, n = 24). B, Quantification of the multiple myeloma–reactive CD8 T cells for lenalidomide control, lenalidomide + GM-CSF control, and vaccinated patients over time. C, Quantification of the multiple myeloma–reactive CD8 T cells comparing nonvaccine controls (n = 21) with vaccinated patients (lenalidomide + GM-CSF + vaccine, n = 24) over time. D, Quantification of the multiple myeloma–reactive CD4 T cells for lenalidomide control, lenalidomide + GM-CSF control, vaccinated patients. Outliers greater than Q3+1.5IQR or less than Q1–1.5IQR are omitted from the figure. Nonsignificant P value (P > 0.05) are not shown in B and D.
Figure 4. Lymphocyte profiles at single-cell resolution following DC/MM fusion vaccination after autoHCT. A, Bar plots portraying the number of cells captured with scRNA-seq per patient (n = 13) and time point (n = 4). B and C, Two-dimensional uniform manifold approximation and projection (UMAP) of all cells passing QC (B; n = 309,423), attributed to 47 cellular populations, and the T-cell compartment (C; n = 146,373), composed of 14 cellular populations and 9 major compartments (pooled data from multiple time points, n = 13 vaccinated patients). D, Dot plot capturing the average expression of marker genes and the percentage of cells expressing them across the distinct cell populations. Low to high average expression is presented in a gray-to-red color gradient. The size of the dot indicates the percentage of cells in each cell population expressing the specific marker genes. E, Two-dimensional uniform manifold approximation and projection (UMAP) plots of all cells in pre-/post-vaccination time points. The distinct cell populations are depicted with distinct colors, corresponding to 12 major lineages. F, Boxplots portraying cell proportion differences in the major cell types among the pre-/postvaccination time points. Each circle represents the cell-type–specific relative abundance per sample. Significantly different proportions of postvaccination time points compared with 90 days posttransplant are denoted with * (*, P < 0.05; **, P < 0.01; Dirichlet multinomial regression). A statistically significant increase in the cell proportions of CD4 and CD8 T cells in the postvaccination time points as compared with 90 days posttransplant is observed, followed by a decrease in NK cells (CD4 T cells; CD8 T cells; NK cells, 90 days posttransplant vs. after 2 vaccinations: P: 9.35 × 10⁻⁶; 6.5 × 10⁻³; 9.6 × 10⁻³, 90 days posttransplant vs. 1 year posttransplant: P: 8.7 × 10⁻³, Dirichlet multinomial regression).
Figure 4.
Lymphocyte profiles at single-cell resolution following DC/MM fusion vaccination after autoHCT. A, Bar plots portraying the number of cells captured with scRNA-seq per patient (n = 13) and time point (n = 4). B and C, Two-dimensional uniform manifold approximation and projection (UMAP) of all cells passing QC (B; n = 309,423), attributed to 47 cellular populations, and the T-cell compartment (C; n = 146,373), composed of 14 cellular populations and 9 major compartments (pooled data from multiple time points, n = 13 vaccinated patients). D, Dot plot capturing the average expression of marker genes and the percentage of cells expressing them across the distinct cell populations. Low to high average expression is presented in a gray-to-red color gradient. The size of the dot indicates the percentage of cells in each cell population expressing the specific marker genes. E, Two-dimensional uniform manifold approximation and projection (UMAP) plots of all cells in pre-/post-vaccination time points. The distinct cell populations are depicted with distinct colors, corresponding to 12 major lineages. F, Boxplots portraying cell proportion differences in the major cell types among the pre-/postvaccination time points. Each circle represents the cell-type–specific relative abundance per sample. Significantly different proportions of postvaccination time points compared with 90 days posttransplant are denoted with * (*, P < 0.05; **, P < 0.01; Dirichlet multinomial regression). A statistically significant increase in the cell proportions of CD4 and CD8 T cells in the postvaccination time points as compared with 90 days posttransplant is observed, followed by a decrease in NK cells (CD4 T cells; CD8 T cells; NK cells, 90 days posttransplant vs. after 2 vaccinations: P: 9.35 × 10⁻⁶; 6.5 × 10⁻³; 9.6 × 10⁻³, 90 days posttransplant vs. 1 year posttransplant: P: 8.7 × 10⁻³, Dirichlet multinomial regression).
Figure 5. T-cell receptor clonality and α/β TCR clonotype sharing following DC/MM fusion vaccination after auto-HCT. A, T-cell receptor clonality at single-cell resolution at the indicated time points is portrayed with distinct colors in a two-dimensional uniform manifold approximation and projection (UMAP) of all T cells. T cells with TCR frequencies between 1 and 4, 5 and 20, and >20 are marked with blue (≥1), red (>4), and yellow (>20), respectively. B, Boxplots portraying the proportions of paired α/β TCRs at different clonotype-frequency thresholds (Unexpanded: α/β TCR frequency = 1, Expanded: α/β TCR frequency: 1≤ clones ≤ 4, 4 < clones ≤ 20, and 20 < clones) in the CD8 activated and T effector memory cells per distinct patient and time point. Each circle represents the TCR frequency normalized by the number of T cells per sample. Significantly different proportions of postvaccination time points compared with prevaccination (enrollment) are denoted with * (*, P < 0.05; **, P < 0.01; Dirichlet multinomial regression). A statistically significant increase in the highly expanded clonotypes (TCR-clonotype freq > 20) of CD8 effector memory T cells postvaccination as compared with prevaccination levels is observed (enrollment vs. after 2 vaccinations: P: 1.38 × 10⁻³¹, enrollment vs. 1 year posttransplant, after 3 vaccinations: P: 2.7 × 10⁻⁷, 90 days posttransplant vs. after 2 vaccinations: P: 0.049, Dirichlet multinomial regression). C, T-cell receptor Shannon diversity index per timepoint for the 13 profiled patients undergoing vaccination. (t1-t2 P = 0.00049, t1-t3 P = 0.36, t1-t4 P = 0.64, t2-t3 P = 0.016, t2-t4 P = 0.092, t3-t4 P = 0.3, two-tailed Wilcoxon signed-rank test adjusted P values using Benjamini–Hochberg false discovery rate). A recovery of T-cell clonal diversity following vaccination that was decreased in the immediate posttransplant period is portrayed. D, TCR clonotype-sharing among the 13 patients analyzed is portrayed at the indicated time points and with the associated quality of response noted. The number (%) of shared β TCR sequence clusters distributed across the patient cohort is depicted in a clear (low) to a red (high) color gradient. The actual number (%) of the shared clonotype clusters among the patients (>20%) is depicted in the relevant pairwise comparisons among patients. The sequence logos (right) represent 69 consensus β TCR sequences with high similarity in more than 6 patients, corresponding to 4 TCR clonotype clusters, 1 year posttransplant and after 3 vaccinations.
Figure 5.
T-cell receptor clonality and α/β TCR clonotype sharing following DC/MM fusion vaccination after auto-HCT. A, T-cell receptor clonality at single-cell resolution at the indicated time points is portrayed with distinct colors in a two-dimensional uniform manifold approximation and projection (UMAP) of all T cells. T cells with TCR frequencies between 1 and 4, 5 and 20, and >20 are marked with blue (≥1), red (>4), and yellow (>20), respectively. B, Boxplots portraying the proportions of paired α/β TCRs at different clonotype-frequency thresholds (Unexpanded: α/β TCR frequency = 1, Expanded: α/β TCR frequency: 1≤ clones ≤ 4, 4 < clones ≤ 20, and 20 < clones) in the CD8 activated and T effector memory cells per distinct patient and time point. Each circle represents the TCR frequency normalized by the number of T cells per sample. Significantly different proportions of postvaccination time points compared with prevaccination (enrollment) are denoted with * (*, P < 0.05; **, P < 0.01; Dirichlet multinomial regression). A statistically significant increase in the highly expanded clonotypes (TCR-clonotype freq > 20) of CD8 effector memory T cells postvaccination as compared with prevaccination levels is observed (enrollment vs. after 2 vaccinations: P: 1.38 × 10⁻³¹, enrollment vs. 1 year posttransplant, after 3 vaccinations: P: 2.7 × 10⁻⁷, 90 days posttransplant vs. after 2 vaccinations: P: 0.049, Dirichlet multinomial regression). C, T-cell receptor Shannon diversity index per timepoint for the 13 profiled patients undergoing vaccination. (t1-t2P = 0.00049, t1-t3P = 0.36, t1-t4P = 0.64, t2-t3P = 0.016, t2-t4P = 0.092, t3-t4P = 0.3, two-tailed Wilcoxon signed-rank test adjusted P values using Benjamini–Hochberg false discovery rate). A recovery of T-cell clonal diversity following vaccination that was decreased in the immediate posttransplant period is portrayed. D, TCR clonotype-sharing among the 13 patients analyzed is portrayed at the indicated time points and with the associated quality of response noted. The number (%) of shared β TCR sequence clusters distributed across the patient cohort is depicted in a clear (low) to a red (high) color gradient. The actual number (%) of the shared clonotype clusters among the patients (>20%) is depicted in the relevant pairwise comparisons among patients. The sequence logos (right) represent 69 consensus β TCR sequences with high similarity in more than 6 patients, corresponding to 4 TCR clonotype clusters, 1 year posttransplant and after 3 vaccinations.

Comment in

References

    1. Richardson PG, Jacobus SJ, Weller EA, Hassoun H, Lonial S, Raje NS, et al. . Triplet therapy, transplantation, and maintenance until progression in myeloma. N Engl J Med 2022;387:132–47. - PMC - PubMed
    1. McCarthy PL, Owzar K, Hofmeister CC, Hurd DD, Hassoun H, Richardson PG, et al. . Lenalidomide after stem-cell transplantation for multiple myeloma. N Engl J Med 2012;366:1770–81. - PMC - PubMed
    1. Zavidij O, Haradhvala NJ, Mouhieddine TH, Sklavenitis-Pistofidis R, Cai S, Reidy M, et al. . Single-cell RNA sequencing reveals compromised immune microenvironment in precursor stages of multiple myeloma. Nat Cancer 2020;1:493–506. - PMC - PubMed
    1. Nakamura K, Smyth MJ, Martinet L. Cancer immunoediting and immune dysregulation in multiple myeloma. Blood 2020;136:2731–40. - PubMed
    1. Alrasheed N, Lee L, Ghorani E, Henry JY, Conde L, Chin M, et al. . Marrow-infiltrating regulatory T cells correlate with the presence of dysfunctional CD4+PD-1+ cells and inferior survival in patients with newly diagnosed multiple myeloma. Clin Cancer Res 2020;26:3443–54. - PubMed

Publication types

MeSH terms

Substances

Associated data