Clinical Trial
. 2025 Jul;31(7):2365-2374.
doi: 10.1038/s41591-025-03650-6. Epub 2025 Apr 9.

Autologous T cell therapy for PRAME+ advanced solid tumors in HLA-A*02+ patients: a phase 1 trial

Affiliations
Clinical Trial

Autologous T cell therapy for PRAME+ advanced solid tumors in HLA-A*02+ patients: a phase 1 trial

Martin Wermke et al. Nat Med. 2025 Jul.

Erratum in

  • Author Correction: Autologous T cell therapy for PRAME+ advanced solid tumors in HLA-A*02+ patients: a phase 1 trial.
    Wermke M, Araujo DM, Chatterjee M, Tsimberidou AM, Holderried TAW, Jazaeri AA, Reshef R, Bokemeyer C, Alsdorf W, Wetzko K, Brossart P, Aslan K, Backert L, Bunk S, Fritsche J, Gulde S, Hengler S, Hilf N, Hossain MB, Hukelmann J, Kalra M, Krishna D, Kursunel MA, Maurer D, Mayer-Mokler A, Mendrzyk R, Mohamed A, Pozo K, Satelli A, Letizia M, Schuster H, Schoor O, Wagner C, Rammensee HG, Reinhardt C, Singh-Jasuja H, Walter S, Weinschenk T, Luke JJ, Britten CM. Wermke M, et al. Nat Med. 2025 Jul;31(7):2453. doi: 10.1038/s41591-025-03731-6. Nat Med. 2025. PMID: 40301562 Free PMC article. No abstract available.

Abstract

In contrast to chimeric antigen receptor T cells, T cell receptor (TCR)-engineered T cells can target intracellular tumor-associated antigens crucial for treating solid tumors. However, most trials published so far show limited clinical activity. Here we report interim data from a first-in-human, multicenter, open-label, 3 + 3 dose-escalation/de-escalation phase 1 trial studying IMA203, an autologous preferentially expressed antigen in melanoma (PRAME)-directed TCR T cell therapy in HLA-A*02+ patients with PRAME+ recurrent and/or refractory solid tumors, including melanoma and sarcoma. Primary objectives include the evaluation of safety and tolerability and the determination of the maximum tolerated dose (MTD) and/or recommended dose for extension. Secondary objectives include the evaluation of IMA203 TCR-engineered T cell persistence in peripheral blood, tumor response as well as duration of response. A total of 27 patients were enrolled in the phase 1a dose escalation and 13 patients in the phase 1b dose extension. IMA203 T cells were safe, and the MTD was not reached. Of the 41 patients receiving treatment (that is, who started lymphodepletion), severe cytokine release syndrome was observed in 4.9% (2/41), and severe neurotoxicity did not occur. In the 40 patients treated with IMA203, an overall response rate consisting of patients with unconfirmed or confirmed response (u/cORR) of 52.5% (21/40) and a cORR of 28.9% (11/38) was observed with a median duration of response of 4.4 months (range, 2.4-23.0, 95% confidence interval: 2.6-not reached) across multiple indications. Rapid T cell engraftment and long-term persistence of IMA203 T cells were observed. IMA203 T cells trafficked to all organs, and confirmed responses were more frequent in patients with higher dose. T cell exhaustion was not observed in the periphery; deep responses were enriched at higher PRAME expression; and higher T cell infiltration resulted in longer progression-free survival. Overall, IMA203 showed promising anti-tumor activity in multiple solid tumors, including refractory melanoma. ClinicalTrials.gov identifier: NCT03686124 .


Conflict of interest statement

Competing interests: M.W.: honoraria: Amgen, Boehringer Ingelheim, Bristol Myers Squibb, Eli Lilly, GWT, Janssen, Merck Novartis, Pfizer, Serono and Synlab; consulting or advisory role: Amgen, AstraZeneca, Bayer, Boehringer Ingelheim, Bristol Myers Squibb, Daiichi Sankyo Europe GmbH, Eli Lilly, ImCheck Therapeutics, Immatics, ISA Pharmaceuticals, Novartis, PharmaMar, Regeneron, Tacalyx and Zymeworks; research funding (to institution): Roche; travel, accommodations, expenses: Amgen, AstraZeneca, Bristol Myers Squibb, Daiichi Sankyo Europe GmbH, GEMoaB, Immatics, Iovance Biotherapeutics, Janssen Oncology, Merck/Senoro, Pfizer and Sanofi/Aventis. D.M.A.: research funding: Adaptimmune, GlaxoSmithKline and Immatics. A.M.T.: consulting or advisory role: Avstera, BioEclipse Therapeutics, BrYet, Diaccurate, Macrogenics, Nex-I and Vincerx; research funding: BrYet (to institution), AbbVie, Agenus, Immatics, Macrogenics, Novocure Ltd., OBI Pharma, Orionis, Parker Institute for Cancer Immunotherapy, Tachyon, Tempus, Tvardi Therapeutics and Vividion Therapeutics. T.A.W.H.: honoraria: Amgen, Bristol Myers Squibb, GlaxoSmithKline and Jazz Pharmaceuticals; consulting or advisory role: AbbVie, Amgen, Bristol Myers Squibb, GlaxoSmithKline, Janssen, Jazz Pharmaceuticals, Kite/Gilead, Novartis, Otsuka, Pfizer, Pierre-Fabre and Sanofi; travel, accomodations, expenses: AbbVie, Amgen, Astellas, BeiGene, Bristol Myers Squibb, GlaxoSmithKline, Immatics, Janssen, Jazz Pharmaceuticals, Kite/Gilead, Kyverna Therapeutics, Medac, Neovii, Sanofi and Sobi. A.A.J.: stock or other ownership: Avenge Bio; consulting or advisory role: Avenge Bio, Eisei, GLG, Guidepoint, Macrogenics, Sentinel Bio and Theolytics; research funding: AstraZeneca, Eli Lilly, Immatics, Immunon, Iovance, Macrogenics, Merck and Xencor; travel, accomodations, expenses: Striker. R.R.: consulting or advisory role: Allogene, Autolus, Gilead, Incyte, Orca Bio, Quell Biotherapeutics, Sana Biotechnology and TScan; research funding (all to institution): AbbVie, Atara Biotherapeutics, Bristol Myers Squibb, Cabaletta, CareDx, Genentech, Gilead, Immatics, Incyte, Johnson & Johnson, Precision Biosciences, Sanofi, Synthekine, Takeda, TCR2 and TScan; expert testimony: Bayer; travel, accommodations, expenses: Gilead and Johnson & Johnson. C.B.: consulting fees: AOK Germany, AstraZeneca, Bayer Healthcare, BioNTech, Lindis Biotech and Sanofi Aventis; payment or honoraria for lectures, presentations, speakersʼ bureaus, manuscript writing or educational events: med update, Merck Serono and Roche Pharma; data safety monitoring board or advisory board: German Society of Hematology and Oncology (DGHO), Hamburg Cancer Society (HKG), German Cancer Society (DKG), National Network of German Cancer Centers (CCC)/German Cancer Aid (DKH) and Northern Germany Society of Internal Medicine (NWGIM). W.A.: consulting or advisory role: Janssen; research funding (received through institution): Affimed and BioNTech; travel, accommodation, expenses: BioNTech, Immatics and Janssen; honoraria: Astellas, AstraZeneca, GlaxoSmithKline and Janssen. H.-G.R.: stock or other ownership: CureVac, Immatics and ViferaXS; consulting or advisory role: Immatics; patents, royalities, other intellectual property: CureVac, Immatics and ViferaXS. P.B.: consulting or advisory role: BeiGene, Bristol Myers Squibb and Kite; research funding: Bristol Myers Squibb. J.J.L.: data safety and monitoring board: AbbVie, Agenus, Evaxion, Immutep and Shionogi; scientific advisory board (no stock): 7 Hills, Affivant, BioCytics, Bright Peak, Exo, Fstar, Inzen, RefleXion and Xilio; scientific advisory board (stock): Actym, Alphamab Oncology, Arch Oncology, Duke Street Bio, Elipscience, Kanaph, NeoTx, Onc.AI, OncoNano, physIQ, Pyxis, Saros, Stipe and Tempest; consultancy with compensation: AbbVie, Agenus, Alnylam, AstraZeneca, Askgene, Atomwise, Bayer, Bristol Myers Squibb, Castle, Checkmate, Codiak, Crown, Cugene, Curadev, Day One, Eisai, EMD Serono, Endeavor, Flame, G1 Therapeutics, Genentech, Geneos, Gilead, Glenmark, HotSpot, Kadmon, Ko Bio Labs, Krystal, KSQ, Janssen, Ikena, Inzen, Immatics, Immunocore, Incyte, Instil, IO Biotech, LegoChem, Lyvgen, Macrogenics, Merck, Mersana, Nektar, Novartis, Partner, Pfizer, Pioneering Medicines, PsiOxus, Regeneron, Replimmune, Ribon, Roivant, Servier, STINGthera, Storm, Sumoitomo, Synlogic, Synthekine and Teva; research support (all to institution): AbbVie, Astellas, AstraZeneca, Bristol Myers Squibb, Corvus, Day One, EMD Serono, Fstar, Genmab, Hot Spot, Ikena, Immatics, Imugene, Incyte, Janux, Kadmon, KAHR, Macrogenics, Merck, Synlogic, Takeda, Trishula, Tizona, Tscan, Werewolf and Xencor; patents: US-11638728 (‘Microbiome biomarkers for anti-PD-1/PD-L1 responsiveness: diagnostic, prognostic and therapeutic uses thereof’). K.A., L.B., S.B., J.F., S.G., S.H., N.H., J.H., M.A.K., D.M., A.M.-M., R.M., M.L., H.S., O.S., C.W., C.R., H.S.-J., T.W. and C.M.B. were employees of Immatics Biotechnologies GmbH during the course of this work and may have securities from Immatics. M.B.H., M.K., D.K., A.M., K.P., A.S. and S.W. were employees of Immatics US, Inc. during the course of this work and may have securities from Immatics. The other authors declare no competing interests.

Figures
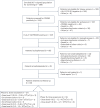
Fig. 1
Fig. 1. CONSORT diagram.
CONSORT diagram indicating the number of patients screened and enrolled in the IMA203-101 trial and reasons for ineligibility. Diagram includes patients with first screening until 7 December 2022. *Patient was included into Supplementary Table 4 (safety data of IMA203) as the patient had treatment-related AEs due to lymphodepletion. ICF, informed consent form.
Fig. 2
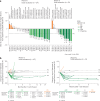
Fig. 2. IMA203 demonstrates deep objective responses across many tumor indications and deep and durable responses in melanoma.
a, Best percent change in sum of diameter of target lesions from baseline and BOR by RECIST 1.1 in IMA203 monotherapy population. Each bar represents an individual patient. Left, BOR of patients treated in the dose escalation (DL1–DL4; n = 27). #Synovial sarcoma patient 19 (DL3) PD at week 6 is not shown as target lesions were not evaluable. Right, BOR of patients treated in the dose extension (DL4 and DL5; n = 13). Ovarian cancer patient 35 (DL5) erroneously received one dose of nivolumab. *Maximum change of target lesions and RECIST 1.1 response at different timepoints. b, Percent change in sum of diameter of target lesions from baseline over time. Left, response over time in IMA203 monotherapy dose-escalation population (n = 27). #Synovial sarcoma patient 19 (DL3) PD at week 6 is not shown as target lesions were not evaluable. Right, response over time in IMA203 monotherapy dose-extension population (n = 13). Ovarian cancer patient 35 (DL5) erroneously received one dose of nivolumab. *Response of patient 30 (DL4) until 5.7 months after infusion; target lesion response assessment is not available (external assessment). Each line represents one patient, with the dots representing tumor assessments. The arrow indicates ongoing response at data cutoff. Colors indicate BOR according to RECIST1.1. The data show deeper and more durable responses in the dose-extension cohort compared to dose escalation. BL, baseline; BOR, best overall response; cPR, confirmed partial response; Cut, cutaneous; MPNST, malignant peripheral nerve sheath tumor; NET, neuroendocrine tumor; NSCLC, non-small cell lung cancer; PD, progressive disease; SCN, small cell neuroendocrine; SD, stable disease; Unk, unknown.
Fig. 3
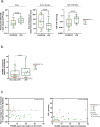
Fig. 3. Best overall response and depth of response were significantly associated with high degree of tumor infiltration.
T cell infiltration correlates with clinical efficacy. a, Bar graph (mean ± s.d.) showing IMA203 TCR T cell infiltration into tumors in patients at day 42 post-infusion biopsies (n = 22). Genomic DNA (gDNA) isolated from pre-infusion and post-infusion biopsies was analyzed by qPCR using lentiviral Psi sequence-specific primers, and the results are expressed as vector copies detected per microgram (μg) of gDNA. Two-tailed Mann–Whitney statistical test was used. The P values are depicted in the respective graphs. b, IMA203 T cell infiltration (vector copies/μg gDNA) values for each patient with post-infusion biopsies plotted against depth of response max % change in sum of the longest diameter of target tumor lesions from baseline (n = 22). c, Best % change in sum of diameter of target lesions compared to baseline according to RECIST 1.1 response plotted against PFS. The P value was determined by two-sided Spearman correlation. The P values and correlation coefficients are depicted in the respective graphs. Each point represents one patient and the respective BOR (color-coded) according to RECIST 1.1. Triangles indicate censored patients (PFS; n = 39). BOR, best overall response; cPR, confirmed partial response; NR, non-responder; PD, progressive disease; R, responder; SD, stable disease.
Extended Data Fig. 1
Extended Data Fig. 1. PRAME mRNA expression across many tumor indications is unimodal.
PRAME target expression distribution (dark gray histograms) based on TCGA RNAseq data where available, patient data (dots, colors indicate BOR according to RECIST1.1) based on in-house qPCR testing of screening biopsies. Numbers in parentheses indicate the number of TCGA patient samples used for TCGA prevalence calculation. 1PRAME target prevalence is based on TCGA RNAseq data combined with a MS-guided RNA expression threshold. 2PRAME target prevalence in uveal melanoma based on in-house qPCR testing of screening biopsies from clinical trial patients (n=33) demonstrates substantial higher prevalence of 91% compared to prevalence based on TCGA data of 50%, TCGA: early & late-stage primary tumor samples; Immatics clinical trials: late-stage/metastatic tumor samples, indicated elevated expression of PRAME in late-stage uveal melanoma patients. BOR: best overall response; cPR: confirmed partial response; HNSCC: head and neck squamous cell carcinoma; MPNST: malignant peripheral nerve sheath tumor; MS: mass spectrometry; NA: not applicable; PD: progressive disease; PR: partial response; RNAseq: RNA sequencing; SD: stable disease; TCGA: The Cancer Genome Atlas.
Extended Data Fig. 2
Extended Data Fig. 2. PRAME expression across many tumor tissues is homogenous.
Spatial mRNA PRAME expression was analyzed using RNAScope in situ hybridization assay. For tumor tissues, the tumor and stroma regions within the tissue were determined by analyzing hematoxylin and eosin staining. Corresponding serial sections were stained for PRAME expression (lower panel). PRAME expression is seen as red punctate dots homogenously distributed throughout the tumor regions. The staining was quantified using immunoreactivity score depicted in the adjacent table. H&E: hematoxylin and eosin; IRS: immunoreactivity score.
Extended Data Fig. 3
Extended Data Fig. 3. Manufacturing process delivers cells enriched in effector memory phenotype with favorable co-stimulation phenotype.
Phenotypic analysis of collected apheresis (n=40) material and final products (n=40) of 40 patients treated with IMA203. Flow cytometric quantification of a) naïve, b) CM, c) TEM, d) TEMRA, e) CD62L, f) CD27, g) CD28, h) CD45RO, i) CD57, j) PD-1, k) TIM-3, l) LAG-3, and m) TIGIT expression on CD3+CD8+-gated lymphocytes. Statistical analysis was performed using two-tailed Wilcoxon matched pairs test with 95% confidence interval. Each dot represent an individual patient. Gating strategy is depicted in Supplementary Fig. 20. CM: central memory T-cells; TEM: effector memory T-cells; TEMRA: effector memory T-cells expressing CD45RA.
Extended Data Fig. 4
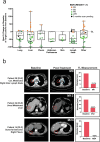
Extended Data Fig. 4. Shrinkage of metastatic lesions throughout the body after IMA203 application.
Lesion shrinkage under IMA203 treatment in different locations throughout the body. a) Best percent change in diameter of target lesions from baseline of all measured target lesions (one to five per patient) in IMA203 monotherapy population (n=21 in lung, n=31 in liver, n=10 in pleura, n=6 in abdomen/peritoneum, n=5 in skin, n=21 in lymph node and n=31 in other); ‘Other’ includes the following non-exhaustive list of organs: adrenal gland, bladder, kidney, spleen, pelvis, bone, brain and muscle. Box plots represent box bounds as the first and third quartiles, with horizontal lines inside the boxes depicting the median. Whiskers reach the minimum and maximum value of the data and each point represents the best change of one individual target lesion. Colors indicate the BOR according to RECIST 1.1 of the patient. b) Case study: CT scan and target lesion measurement (baseline and post-treatment) of patient 38 (DL5; cutaneous melanoma, post-baseline scan ~9 months post-T-cell infusion), patient 34 (DL5; uveal melanoma, post baseline scan ~12 months post-T-cell infusion), and patient 14 (DL2; synovial sarcoma, post-baseline scan ~24 months post-T-cell infusion). Red circles mark target lesion and green circles mark non-target lesion. BL: baseline; BOR: best overall response; cPR: confirmed partial response; PD: progressive disease; PR: partial response; RECIST: Response Evaluation Criteria in Solid Tumors; SD: stable disease.
Extended Data Fig. 5
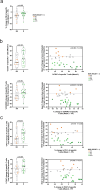
Extended Data Fig. 5. Higher TCR T dose, dose:tumor burden ratio, PRAME expression and lower tumor burden are associated with durable responses.
a) IMA203 T-cell dose, tumor burden and TB ratio is associated with durable responses. Dose, that is, number of infused TCR T-cells (transduced viable CD8+ T-cells), tumor burden (sum of diameters of target lesions at baseline), and TCR T dose:TB ratio (approximation by dividing infused TCR T-cells by TB), are depicted for non-responders/short term responders (PD/SD/PR, n=27) and confirmed durable responders (cPR, n=11). Two patients (39 [DL5] and 36 [DL5]) were not included in this analysis since second post-treatment scan was pending at data cut-off and final BOR is not yet determined. Group comparisons were performed using two-sided Mann-Whitney U statistical test. Box plots depict median as horizontal lines within boxes, with box bounds as the first and third quartiles. Whiskers range from minimum to maximum values. b) PRAME mRNA expression from patient tumor biopsies (cPR n=11, PD/SD/PR n=27) was measured by qPCR. Delta cycle threshold (DCt) values meeting the predefined threshold criteria (DCt threshold) were used as predictive for target peptide presentation. Measured DCt is normalized to the DCt threshold (2^-(dCT-Threshold)). Two-sided Mann-Whitney U statistical test was used. Box plots depict median as horizontal lines within boxes, with box bounds as the first and third quartiles. Lower whisker is the minimum value of the data within 1.5 times the interquartile range below the 25th percentile. Upper whisker is the maximum value of the data within 1.5 times the interquartile range above the 75th percentile. c) Impact of pre-treatment PRAME mRNA expression (relative to threshold) on reduction in tumor size of target lesions and impact of pre-treatment PRAME mRNA expression (relative to threshold) on PFS for patients treated with IMA203 T-cells (n=39). The p-value was determined by two-sided Spearman correlation. The p-values and correlation coefficients are depicted in the respective graphs. Each point represents one patient and the respective BOR (color-coded) according to RECIST1.1. For PFS analysis, censored patients were indicated with triangle shapes. BOR: best overall response; cPR: confirmed partial response; NR: non-responder; PD: progressive disease; PFS: progression-free survival; PR: partial response; R: responder; RECIST: Response Evaluation Criteria in Solid Tumors; SD: stable disease; TB: tumor burden.
Extended Data Fig. 6
Extended Data Fig. 6. Rapid T-cell engraftment and long-term persistence observed in pharmacokinetic studies.
IMA203 product persisted up to 743 days post-infusion which was determined using qPCR-based assay. Genomic DNA was isolated from post-infusion PBMC and IMA203 T-cells were detected by using absolute qPCR assay with lentiviral Psi sequence of vector. Number of T-cells is reported per µg of gDNA used in the assay.
Extended Data Fig. 7
Extended Data Fig. 7. Trends emerge with post-infusion activation/differentiation state of IMA203 T-cells association with responses and depth of responses.
a) Memory phenotype associates with responses 2 weeks post-infusion. Changes in central memory phenotype (CCR7+ CD45RA-) from post-infusion (week 2) to FP were compared between non-responders (n=19) vs. responders (n=19). b) Changes in activation/differentiation markers post-infusion at week 2 or week 2 compared to FP between non-responders (n=19) vs. responders (n=20). Week 2 %CD27 expression in tetramer-positive CD8+ T-cells and the difference between week 2 to FP for %CD45RO-expressing tetramer-positive CD8+ T-cell ratio. c) Changes in activation/exhaustion markers post-infusion (week 2) compared to FP associates with clinical responses. Changes in TIGIT and PD-1-expressing tetramer-positive CD8+ T-cell ratio from product level to week 2 post-infusion in non-responders (n=19) vs. responders (n=19). Group comparisons were performed using a two-tailed Mann-Whitney test with 95% confidence interval. A two-tailed Spearman r correlation with 95% confidence interval was performed for correlation analysis. The p-values and correlation coefficients are depicted in the respective graphs. The bar inside the violin plots represents the median value and each point represents one patient and the respective BOR (color-coded) according to RECIST1.1. Gating strategy is depicted in Supplementary Fig. 20. BOR: best overall response; CM: central memory T-cells; cPR: confirmed partial response; FP: final product; NR: non-responder; PD: progressive disease; PFS: progression-free survival; PR: partial response; R: responder; RECIST: Response Evaluation Criteria in Solid Tumors; SD: stable disease.
Extended Data Fig. 8
Extended Data Fig. 8. Antigen processing and presentation machinery is upregulated in tumor microenvironment in responders.
Gene expression analysis for the antigen processing and presentation machinery gene set was performed via RNAseq obtained from matching pre-treatment (Pre) and post-treatment day 42 (D42) tissue biopsies from five responder and three non-responder patients. Gene expression was provided as log2(transcript per million [TPM]) and a gene specific pseudocount. Gene products upregulated more than twofold difference were marked with green while the ones downregulated more than twofold marked with red. The antigen processing and presentation machinery gene set contains the following genes: ABCB9, ACE, AZGP1, B2M, CALR, CLEC4A, ERAP1, ERAP2, FCER1G, FCGR1A, HFE, HLA-A, IDE, IFI30, IKBKB, LNPEP, MFSD6, MR1, PDIA3, SAR1B, TAP1, TAP2, TAPBP, and TAPBPL. NR: non-responder; P: patient; R: responder.
Extended Data Fig. 9
Extended Data Fig. 9. Signs of adaptive resistance observed in the tumor microenvironment.
Gene expression analysis for the antigen processing and presentation machinery gene set was performed via RNAseq obtained from matching pre-treatment (Pre) and post-treatment day 42 (D42) tissue biopsies from five responder and three non-responder patients. Gene expression was provided as log2(transcript per million [TPM]) and a gene specific pseudocount. Gene products upregulated more than twofold difference were marked with green while the ones downregulated more than twofold marked with red. The gene set to find signs of adaptive resistance contained: ARG1, BTLA, CD160, CD244, CD274, CEACAM1, CLEC4G, CTLA4, FCGR2B, FGL1, FOXP3, HAVCR2, HLA-G, HMGB1, IFNA2, IFNB1, KLRC1, LAG3, LGALS3, LGALS9, LILRB1, LILRB4, NECTIN2, NECTIN3, PDCD1, PDCD1LG2, PVR, TBX21, TIGIT, TNFRSF14, and VSIR. NR: non-responder; P: patient; R: responder.

References

    1. Norberg, S. M. & Hinrichs, C. S. Engineered T cell therapy for viral and non-viral epithelial cancers. Cancer Cell41, 58–69 (2023). - PMC - PubMed
    1. Leko, V. & Rosenberg, S. A. Identifying and targeting human tumor antigens for T cell-based immunotherapy of solid tumors. Cancer Cell38, 454–472 (2020). - PMC - PubMed
    1. Klebanoff, C. A., Chandran, S. S., Baker, B. M., Quezada, S. A. & Ribas, A. T cell receptor therapeutics: immunological targeting of the intracellular cancer proteome. Nat. Rev. Drug Discov.22, 996–1017 (2023). - PMC - PubMed
    1. Johnson, L. A. et al. Gene therapy with human and mouse T-cell receptors mediates cancer regression and targets normal tissues expressing cognate antigen. Blood114, 535–546 (2009). - PMC - PubMed
    1. Moore, T. et al. Clinical and immunologic evaluation of three metastatic melanoma patients treated with autologous melanoma-reactive TCR-transduced T cells. Cancer Immunol. Immunother.67, 311–325 (2018). - PMC - PubMed

Publication types

MeSH terms

Associated data