Clinical Trial
. 2023 Dec;29(12):3127-3136.
doi: 10.1038/s41591-023-02635-7. Epub 2023 Nov 13.

IRAK4 degrader in hidradenitis suppurativa and atopic dermatitis: a phase 1 trial

Affiliations
Clinical Trial

IRAK4 degrader in hidradenitis suppurativa and atopic dermatitis: a phase 1 trial

Lindsay Ackerman et al. Nat Med. 2023 Dec.

Abstract

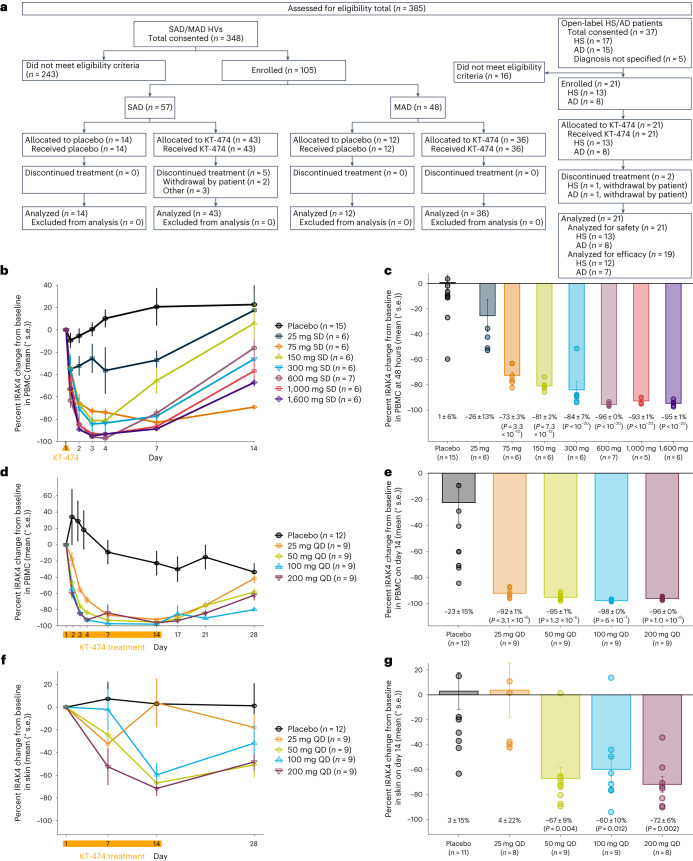
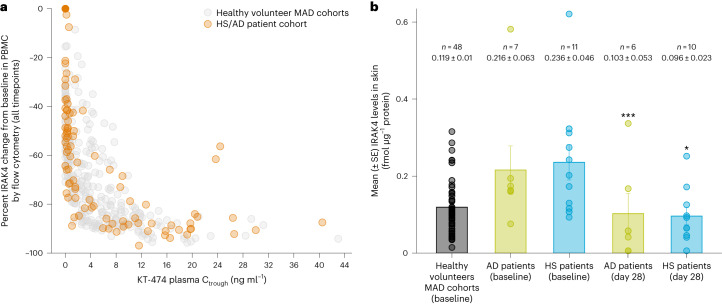
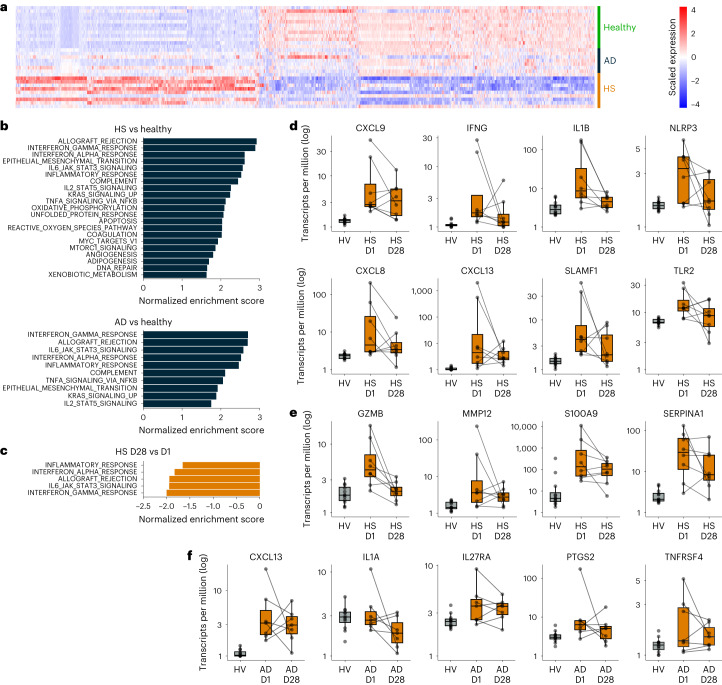
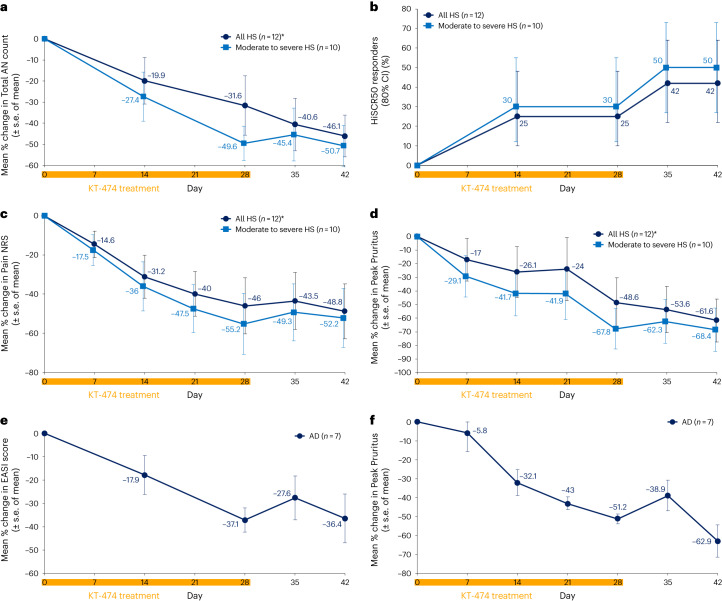
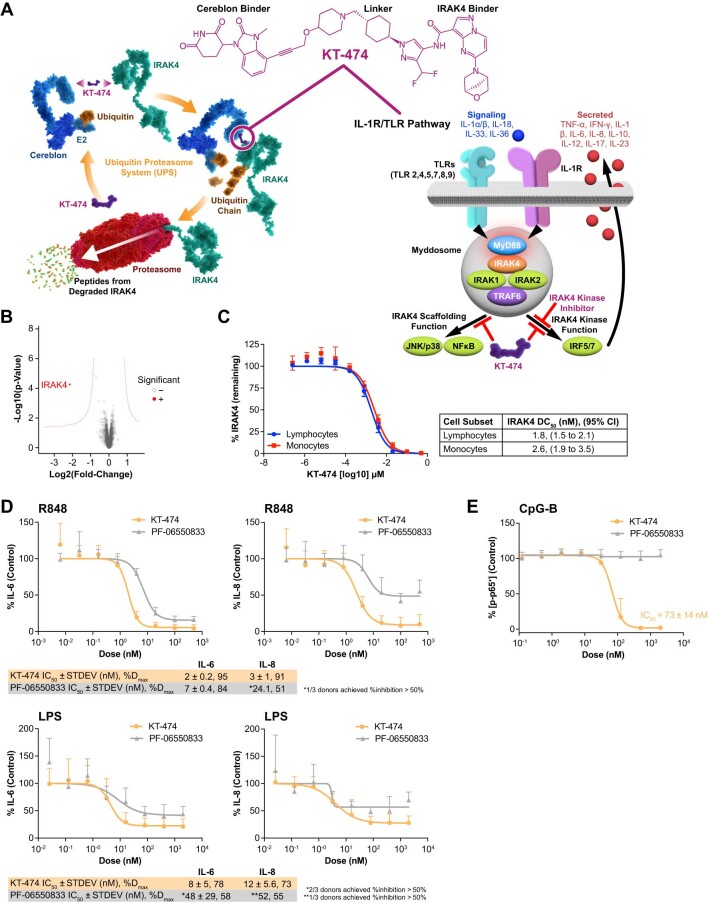
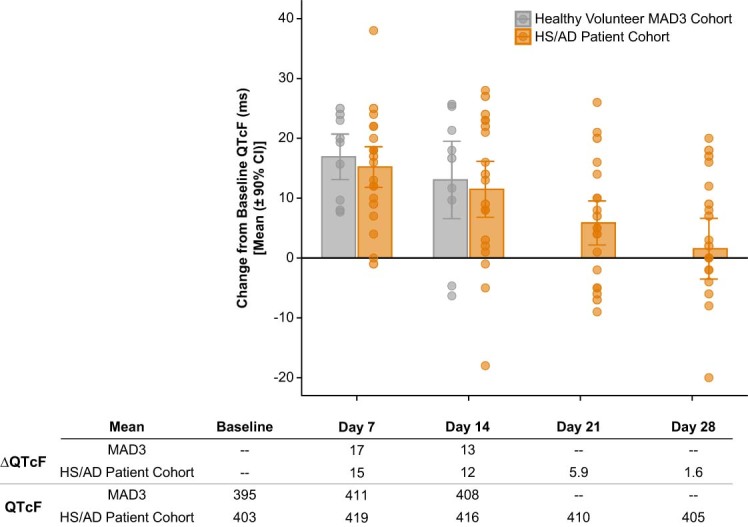
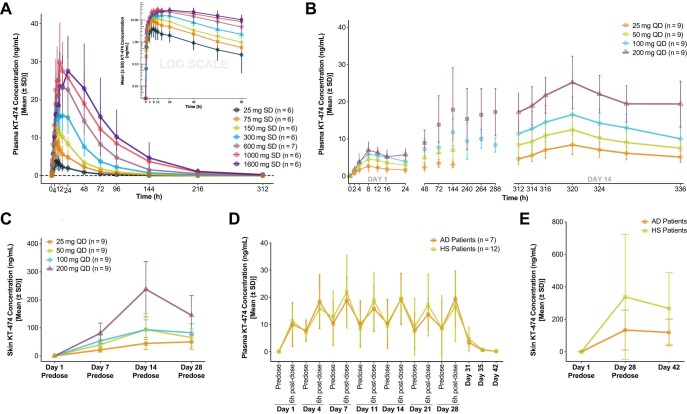
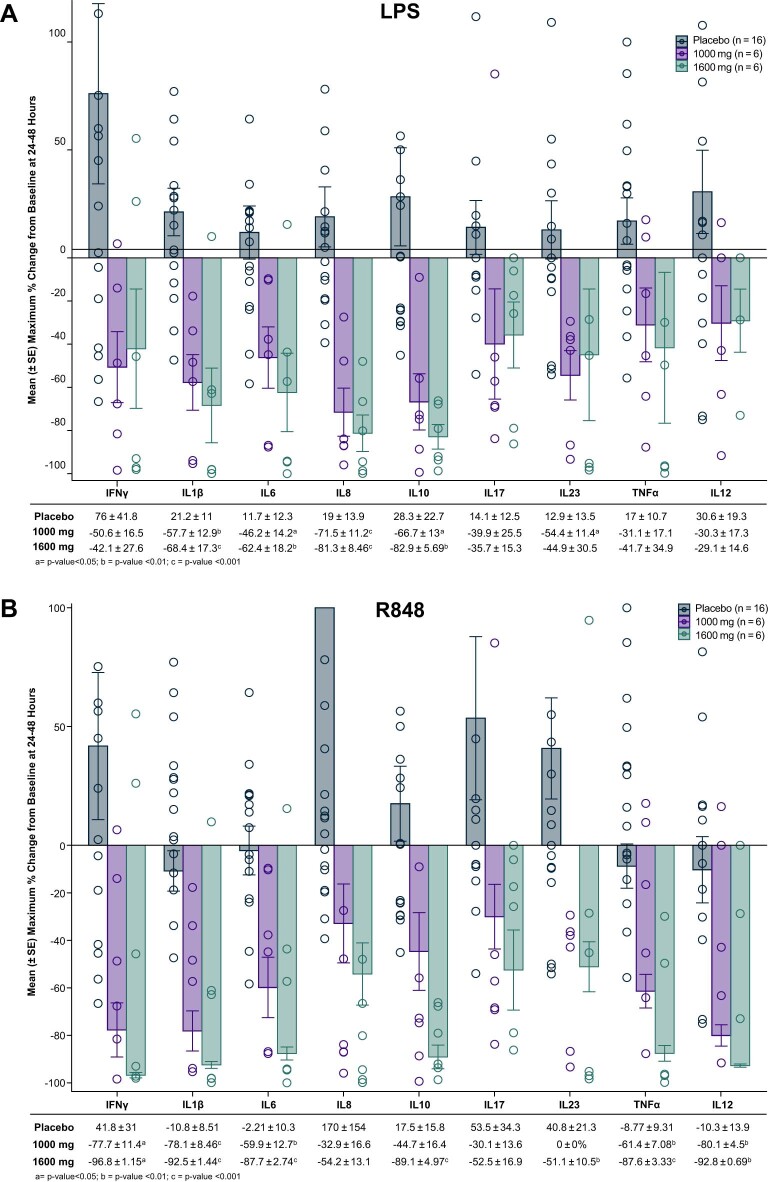
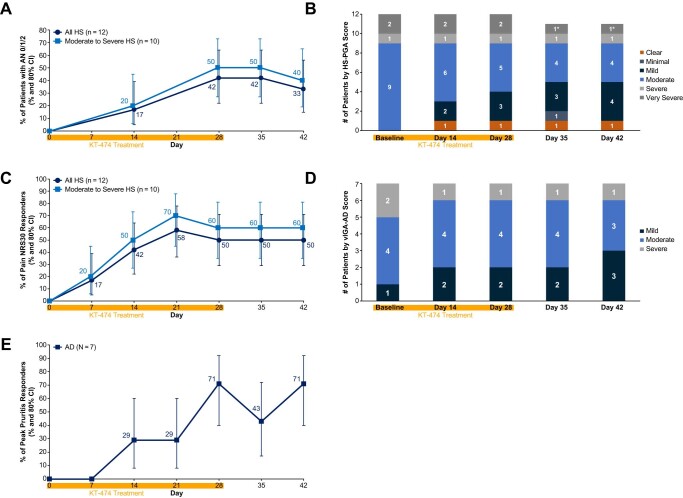
Toll-like receptor-driven and interleukin-1 (IL-1) receptor-driven inflammation mediated by IL-1 receptor-associated kinase 4 (IRAK4) is involved in the pathophysiology of hidradenitis suppurativa (HS) and atopic dermatitis (AD). KT-474 (SAR444656), an IRAK4 degrader, was studied in a randomized, double-blind, placebo-controlled phase 1 trial where the primary objective was safety and tolerability. Secondary objectives included pharmacokinetics, pharmacodynamics and clinical activity in patients with moderate to severe HS and in patients with moderate to severe AD. KT-474 was administered as a single dose and then daily for 14 d in 105 healthy volunteers (HVs), followed by dosing for 28 d in an open-label cohort of 21 patients. Degradation of IRAK4 was observed in HV blood, with mean reductions after a single dose of ≥93% at 600-1,600 mg and after 14 daily doses of ≥95% at 50-200 mg. In patients, similar IRAK4 degradation was achieved in blood, and IRAK4 was normalized in skin lesions where it was overexpressed relative to HVs. Reduction of disease-relevant inflammatory biomarkers was demonstrated in the blood and skin of patients with HS and patients with AD and was associated with improvement in skin lesions and symptoms. There were no drug-related infections. These results, from what, to our knowledge, is the first published clinical trial using a heterobifunctional degrader, provide initial proof of concept for KT-474 in HS and AD to be further confirmed in larger trials. ClinicalTrials.gov identifier: NCT04772885 .


Conflict of interest statement

A.G., V.C., A.D., S.A., R.K., K.S., A.M., C.K., B.E., V.M., E.K., K.S., E.K., R.B., D.C., X.Z., V.S., C.H., N.M., A.S. and J.A.G. are Kymera Therapeutics employees and may have stock or stock options. J.D. and H.R. are former Kymera Therapeutics employees and may have stock or stock options. J.C. is a full-time consultant working for Kymera Therapeutics. All other authors (L.A., G.A., S.B., H.S., B.J.F., P.L. and A.A.) are employees of their respective companies; they were investigators from clinical sites in the trial and received payment for their participation in the trial.

Figures

Fig. 1
Fig. 1. CONSORT diagram and IRAK4 degradation in blood and skin of HVs treated with KT-474 measured by targeted mass spectrometry.
a, CONSORT diagram for phase 1 trial of KT-474. b, Mean (±s.e.) IRAK4 degradation over time in PBMCs after single dose of KT-474 on day 1 (dosing indicated by orange arrow, n = 6 per dose group except 600 mg SD (n = 7) and placebo (n = 15)). c, Mean (±s.e.) IRAK4 degradation in PBMCs at 48 h after single dose (n = 6 per dose group except 600 mg SD (n = 7) and placebo (n = 15)). d, Mean (±s.e.) IRAK4 degradation over time in PBMCs over 14 d of dosing with KT-474 (dosing period indicated by orange bar, n = 9 per dose group except placebo (n = 12)). e, Mean (±s.e.) IRAK4 degradation in PBMCs at steady-state nadir on day 14 (n = 9 per dose group except placebo (n = 12)). f, Mean (±s.e.) IRAK4 degradation over time in skin biopsies over 14 d of dosing with placebo (n = 14), 25 mg QD (n = 8), 50 mg QD (n = 9), 100 mg QD (n = 9) and 200 mg QD (n = 8). g, Mean (±s.e.) IRAK4 degradation in skin on day 14 (n = 11 for placebo, n = 8 for 25 mg QD and 200 mg QD, n = 9 for 50 mg QD and 100 mg QD). Treatment groups were compared to placebo (number of patients per group mentioned above for each subpanel) using one-way ANOVA models with Tukey correction for multiple comparisons. QD, once daily; SD, single dose. Source data
Fig. 2
Fig. 2. IRAK4 reduction by KT-474 in blood and skin lesions of patients with HS or AD.
a, Relationship between IRAK4 knockdown in PBMCs and plasma KT-474 trough levels in HV MAD cohorts and the HS/AD patient cohort. b, Mean (±s.e.) IRAK4 levels in skin of patients with AD (n = 7) and patients with HS (n = 11) at baseline compared to HVs (MAD1–4 n = 48) and after 28 d (n = 6 for AD and n = 10 for HS) of KT-474 dosing. IRAK4 levels on day 28 were compared to baseline using one-way ANOVA models. *P = 0.012 and ***P = 0.0009. Source data
Fig. 3
Fig. 3. RNA-seq analysis of skin lesion biopsies in patients with HS (n = 8) or AD (n = 7) taken before and after KT-474 treatment compared to HV skin (n = 12).
a, Heat map showing differentially expressed genes (FDR q < 0.05, absolute fold change ≥ 2) between HVs from MAD3 and patients with HS and patients with AD pre-treatment. b, Normalized enrichment scores for pathways that were significantly upregulated (FDR q < 0.01) pre-treatment in patients with HS and patients with AD compared to HVs. c, Normalized enrichment scores for pathways that were significantly downregulated (FDR q < 0.01) at day 28 versus day 1 pre-dose in patients with HS. d, Proinflammatory markers at day 1 pre-dose (HS D1) and day 28 (HS D28) in patients with HS with comparison to pre-treatment expression in HVs. e, Complement pathway markers at day 1 pre-dose (HS D1) and day 28 (HS D28) in patients with HS with comparison to pre-treatment expression in HVs. f, Proinflammatory markers at day 1 pre-dose (AD D1) and day 28 (AD D28) in patients with AD with comparison to pre-treatment expression in HVs. In df, lines connect measurements from the same patient at day 1 pre-dose and day 28. Boxes show median and interquartile range. The upper whisker extends to the largest value no further than 1.5× interquartile range. The lower whisker extends to the smallest value at most 1.5× interquartile range. MAD3, MAD cohort 3. Source data
Fig. 4
Fig. 4. Clinical responses to KT-474 in patients with HS or AD.
af, Improvement in skin lesions and symptoms in patients with HS (ad) and patients with AD (ef) treated with KT-474 for 28 d. CI, confidence interval. *One patient was censored for day 35 and day 42 because the patient was started on ustekinumab, steroids and antibiotics on day 34. Source data
Extended Data Fig. 1
Extended Data Fig. 1. Identification of KT-474 (SAR444656) as a potent and selective degrader of IRAK4.
(a) KT-474 chemical structure, mechanism of action and potential advantage over IRAK4 kinase inhibitors on inhibition of TLR–/IL-1R–driven myddosome signaling through its effects on scaffolding and kinase functions of IRAK4. © 2023 Kymera Therapeutics, Inc. (b) Highly selective degradation of IRAK4 by KT-474 in human PBMCs determined by discovery proteomics. A paired statistical analysis was performed using linear models and significant degradation was determined by application of a weighted cutoff incorporating both significance and fold-change. (c) Potent degradation of IRAK4 by KT-474 in lymphocyte and monocyte subsets of PBMCs using N = 3 biologically independent donors over 1 experiment. (d) Superior inhibition of IL-6 and IL-8 production in R848- or LPS-stimulated PBMCs by KT-474 compared to the IRAK4 kinase inhibitor PF-06550833 using N = 3 biologically independent donors and 2 technical replicates over 1 experiment. (e) Inhibition of NF-kB activation (phospho-p65) in CpG-B stimulated B cells by KT-474 but not PF-06550833 using N = 5 biologically independent donors over 2 experiments. All data in (c) through (e) are graphed as mean values +/- STDEV. CI = confidence interval; IC50 = concentration of a drug needed to inhibit a biological process or response by 50%; IL = interleukin; LPS = lipopolysaccharide; PBMCs = peripheral blood mononuclear cells; R = receptor; STDEV = standard deviation; TLR = toll-like receptor. Source data
Extended Data Fig. 2
Extended Data Fig. 2. QTcF prolongation in healthy volunteer MAD cohort 3 (MAD3; 100 mg) and in open-label HS/AD patient cohort.
Mean change from baseline (ΔQTcF) and absolute QTcF values are shown at the indicated time points for MAD3 (100 mg daily fasted x 14 days, n = 9) and open-label patient cohort (75 mg daily fed x 28 days, n = 20). AD = atopic dermatitis; CI = confidence interval; HS = hidradenitis suppurativa; MAD = multiple ascending doses; QTcF = corrected QT interval by Fredericia. Source data
Extended Data Fig. 3
Extended Data Fig. 3. Pharmacokinetics of KT-474 in plasma and skin in healthy volunteers (HVs) and patients with atopic dermatitis (AD) and hidradenitis suppurativa (HS).
Mean ( ± standard deviation [SD]) plasma concentration-time profiles for KT-474 following ascending single doses (a) and ascending multiple once daily doses x 14 days (b) of KT-474 in HVs. (c) Mean concentration-time profiles for KT-474 in skin following ascending multiple once daily doses x 14 days of KT-474 in HVs. Mean concentration-time profiles for KT-474 in plasma (d) and skin lesions (e) following once daily doses of KT-474 75 mg x 28 days in patients with AD (n = 7) and HS (n = 12). QD = once daily. Source data
Extended Data Fig. 4
Extended Data Fig. 4. Inhibition of TLR-stimulated ex vivo cytokine production in blood of healthy volunteers treated with a single dose of KT-474.
Maximum change from baseline at 24–48 hours post-dose in cytokine induction by TLR7/8 agonist R848 (a) or TLR4 agonist LPS (b) in healthy volunteers treated with placebo (n = 16), 1000 mg SD (n = 6) and 1600 mg SD (n = 6). Treatment groups were compared to placebo using one-way analysis of variance (ANOVA) models with Tukey correction for multiple comparisons. LPS = lipopolysaccharide; SAD = single ascending dose; SD = single dose; SE = standard error. Source data
Extended Data Fig. 5
Extended Data Fig. 5. Clinical responses to KT-474 in hidradenitis suppurativa (HS) and atopic dermatitis (AD) patients.
Improvement in skin lesions and symptoms in HS (a-c) and AD (d-e) patients treated with KT-474 for 28 days. Data are presented as % of responders and the 80% confidence interval of the % (a, c, and e). AN = abscess and nodule count; CI = confidence interval; HS-PGA = hidradenitis suppurativa Physician’s Global Assessment; NRS = Numerical Rating Scale; vIGA-AD = validated Investigator Global Assessment for AD. *One patient was censored for Day 35 and Day 42 because the patient started on ustekinumab, steroids and antibiotics on Day 34. Source data

Comment in

References

    1. Fitzgerald KA, Kagan JC. Toll-like receptors and the control of immunity. Cell. 2020;180:1044–1066. - PMC - PubMed
    1. Dinarello CA. The IL-1 family of cytokines and receptors in rheumatic diseases. Nat. Rev. Rheumatol. 2019;15:612–632. - PubMed
    1. Marshak-Rothstein A. Toll-like receptors in systemic autoimmune disease. Nat. Rev. Immunol. 2006;6:823–835. - PMC - PubMed
    1. Kumar V. Going, Toll-like receptors in skin inflammation and inflammatory diseases. EXCLI J. 2021;20:52–79. - PMC - PubMed
    1. Brown GJ, et al. TLR7 gain-of-function genetic variation causes human lupus. Nature. 2022;605:349–356. - PMC - PubMed

Publication types

Substances

Associated data