. 2012;7(6):e39657.
doi: 10.1371/journal.pone.0039657. Epub 2012 Jun 26.

Satellite cells derived from obese humans with type 2 diabetes and differentiated into myocytes in vitro exhibit abnormal response to IL-6

Affiliations

Satellite cells derived from obese humans with type 2 diabetes and differentiated into myocytes in vitro exhibit abnormal response to IL-6

Camilla Scheele et al. PLoS One. 2012.

Abstract

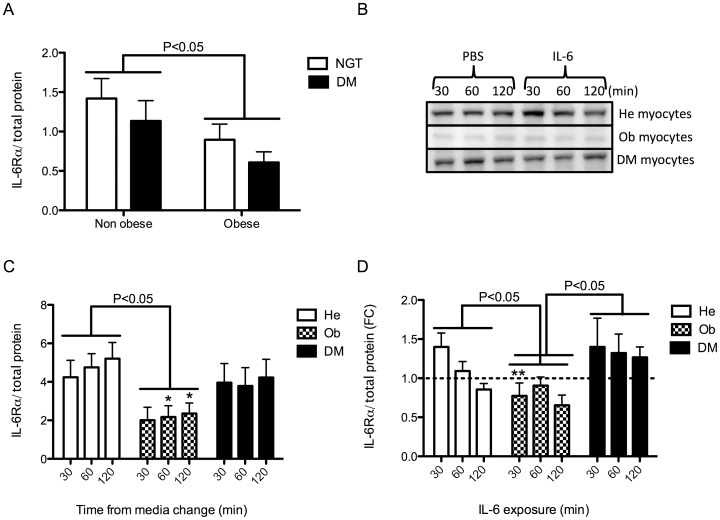
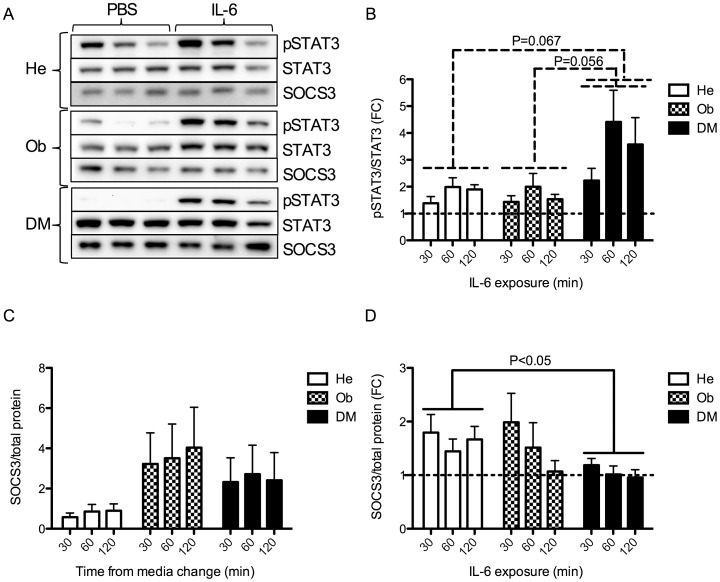
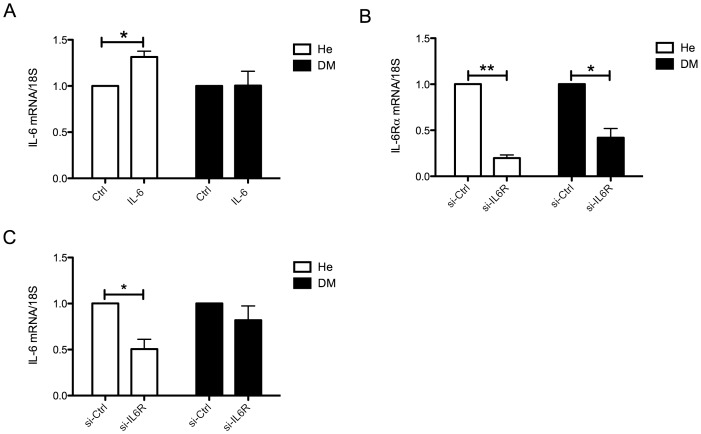
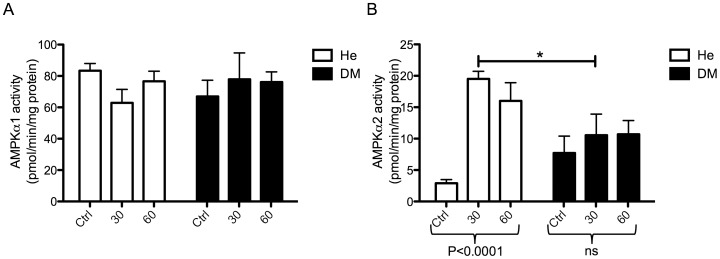
Obesity and type 2 diabetes are associated with chronically elevated systemic levels of IL-6, a pro-inflammatory cytokine with a role in skeletal muscle metabolism that signals through the IL-6 receptor (IL-6Rα). We hypothesized that skeletal muscle in obesity-associated type 2 diabetes develops a resistance to IL-6. By utilizing western blot analysis, we demonstrate that IL-6Rα protein was down regulated in skeletal muscle biopsies from obese persons with and without type 2 diabetes. To further investigate the status of IL-6 signaling in skeletal muscle in obesity-associated type 2 diabetes, we isolated satellite cells from skeletal muscle of people that were healthy (He), obese (Ob) or were obese and had type 2 diabetes (DM), and differentiated them in vitro into myocytes. Down-regulation of IL-6Rα was conserved in Ob myocytes. In addition, acute IL-6 administration for 30, 60 and 120 minutes, resulted in a down-regulation of IL-6Rα protein in Ob myocytes compared to both He myocytes (P<0.05) and DM myocytes (P<0.05). Interestingly, there was a strong time-dependent regulation of IL-6Rα protein in response to IL-6 (P<0.001) in He myocytes, not present in the other groups. Assessing downstream signaling, DM, but not Ob myocytes demonstrated a trend towards an increased protein phosphorylation of STAT3 in DM myocytes (P = 0.067) accompanied by a reduced SOCS3 protein induction (P<0.05), in response to IL-6 administration. Despite this loss of negative control, IL-6 failed to increase AMPKα2 activity and IL-6 mRNA expression in DM myocytes. There was no difference in fusion capacity of myocytes between cell groups. Our data suggest that negative control of IL-6 signaling is increased in myocytes in obesity, whereas a dysfunctional IL-6 signaling is established further downstream of IL-6Rα in DM myocytes, possibly representing a novel mechanism by which skeletal muscle function is compromised in type 2 diabetes.


Conflict of interest statement

Competing Interests: The authors have declared that no competing interests exist.

Figures

Figure 1
Figure 1. IL-6Rα protein expression in skeletal muscle tissue biopsies and in He, Ob and DM myocytes in response to IL-6.
(A) Protein expression of IL-6Rα was assessed in skeletal muscle biopsies from the vastus lateralis muscle of non-obese (n = 10) or obese (n = 10) normal glucose tolerant (NGT) subjects and non-obese (n = 10) or obese (n = 9) subjects with type 2 diabetes (Table 1), using western blot analysis. Due to the variability in these in vivo samples, all blots are presented in Figure S1. A two-way ANOVA was performed, comparing the effect of obesity and the effect of diabetes on IL-6Rα protein expression. (B) Protein expression of IL-6Rα was assessed in satellite cells isolated from healthy (He) (n = 7), obese (Ob) (n = 7) and obese people (n = 7) with type 2 diabetes (DM) (Table 2). Satellite cells were differentiated into myocytes and treated with IL-6 (100 ng/ml) or control (PBS) for 30, 60 and 120 min. (C) Baseline IL-6Rα protein expression was normalized to total protein expression (as determined by reactive brown staining) and compared between groups by two-way ANOVAs. (D) IL-6 induced IL-6Rα protein expression was normalized to total protein and compared between groups by two-way ANOVAs and effect of time within groups was assessed with one-way ANOVAs. Data are presented as fold change (FC) between the control samples presented in B and C and samples treated with IL-6 (100 ng/ml). Data are mean ± SE. Groups were compared in pairs (i.e. He vs Ob, He vs DM and Ob vs DM) by two-way ANOVAs. Results from ANOVAs are marked in the figures with connecting capped arcs. *Results from Bonferroni post-tests, relative to He myocytes; *P<0.05, **P<0.01, ***P<0.001.
Figure 2
Figure 2. pSTAT3/STAT3 and SOCS3 protein expression in He, Ob and DM myocytes in response to IL-6.
(A) Protein expression of STAT3, pSTAT3 and SOCS3 was assessed in satellite cells isolated from healthy (He) (n = 7), obese (Ob) (n = 7) and obese people with type 2 diabetes (DM) (n = 7) (Table 2). Satellite cells were differentiated into myocytes and treated with IL-6 (100 ng/ml) or control (PBS) for 30, 60 and 120 min (same protein samples as in Figure 1 B-D). (B) IL-6 induced phosphorylated STAT3 was related to total STAT3 levels and IL-6 treated samples were presented as fold change from PBS treated samples. IL-6 induction of pSTAT3 was compared between groups by two-way ANOVAs. (C) Baseline SOCS3 protein expression in the samples described in A was normalized to total protein expression (as determined by reactive brown staining) and compared between groups by two-way ANOVAs. (D) IL-6 induced SOCS3 protein expression was normalized to total protein expression and compared between groups by two-way ANOVAs. Data are presented as fold change (FC) between the control samples presented in A and C and samples treated with IL-6 (100 ng/ml). Data are mean ± SE. Groups were compared in pairs (i.e. He vs Ob, He vs DM and Ob vs DM) by two-way ANOVAs. Results from ANOVAs are marked in the figures with connecting capped arcs. *Results from Bonferroni post-tests, relative to He myocytes; *P<0.05, **P<0.01, ***P<0.001.
Figure 3
Figure 3. IL-6 induction of IL-6 mRNA in human myocytes.
Muscle precursor cells derived from the vastus lateralis muscle of healthy (He), and obese people with type 2 diabetes (DM) (Table 3) (A) He myocytes (n = 5) and DM myocytes (n = 5) were treated with recombinant IL-6 or PBS for 60 minutes and IL-6 mRNA expression was assessed using qPCR. (B) Muscle precursor cells derived from healthy (n = 4), and obese people with type 2 diabetes (n = 4) were differentiated into myocytes and, during the last two days of differentiation transfected with siRNA targeting IL-6Rα. IL-6Rα knockdown was assessed using qPCR following 48 hrs of transfection. (C) IL-6 mRNA expression following IL-6Rα knockdown was assessed using qPCR following 48 hrs of transfection. Data were normalized to control treated samples within each cell subject and differences between groups were assessed using paired t-tests of dCT values. Data are mean ± SE *P<0.05, **P<0.01, ***P<0.001.
Figure 4
Figure 4. AMPK activity in response to IL-6 in myocytes from healthy and people with type 2 diabetes.
Muscle precursor cells derived from the vastus lateralis muscle of healthy (He) (n = 5), and obese people with type 2 diabetes (DM) (n = 5) (Table 3), were differentiated into myocytes and were treated with recombinant IL-6 for 30 or 60 minutes. Controls (Ctrl) were treated with PBS for 60 minutes. Protein was isolated and AMPK activity was measured (A) AMPK α1 activity in response to IL-6 was compared between groups by a two-way ANOVA. (B) AMPK α2 activity in response to IL-6 was compared between groups by a two-way ANOVA. While there was no effect of group, there was an interaction (P<0.01) and thus Bonferroni post-tests were performed. Effect of treatment within groups was performed by one-way ANOVAs. Data are mean ± SE. *Results from Bonferroni post-tests, relative to He myocytes; *P<0.05, **P<0.01, ***P<0.001.

References

    1. Ostrowski K, Rohde T, Zacho M, Asp S, Pedersen BK. Evidence that interleukin-6 is produced in human skeletal muscle during prolonged running. J Physiol 508 (Pt. 1998;3):949–953. - PMC - PubMed
    1. Steensberg A, van HG, Osada T, Sacchetti M, Saltin B, et al. Production of interleukin-6 in contracting human skeletal muscles can account for the exercise-induced increase in plasma interleukin-6. J Physiol 529 Pt 1: 237–242. PHY_11483 [pii] 2000. - PMC - PubMed
    1. Richter EA, Mikines KJ, Galbo H, Kiens B. Effect of exercise on insulin action in human skeletal muscle. J Appl Physiol. 1989;66:876–885. - PubMed
    1. Mohamed-Ali V, Goodrick S, Rawesh A, Katz DR, Miles JM, et al. Subcutaneous adipose tissue releases interleukin-6, but not tumor necrosis factor-alpha, in vivo. J Clin Endocrinol Metab. 1997;82:4196–4200. - PubMed
    1. Bastard JP, Maachi M, Van Nhieu JT, Jardel C, Bruckert E, et al. Adipose tissue IL-6 content correlates with resistance to insulin activation of glucose uptake both in vivo and in vitro. J Clin Endocrinol Metab. 2002;87:2084–2089. - PubMed

Publication types

Associated data