. 2019 Nov;43(11):2332-2343.
doi: 10.1111/acer.14200. Epub 2019 Oct 8.

Alcohol's Dysregulation of Maternal-Fetal IL-6 and p-STAT3 Is a Function of Maternal Iron Status

Affiliations

Alcohol's Dysregulation of Maternal-Fetal IL-6 and p-STAT3 Is a Function of Maternal Iron Status

Nipun Saini et al. Alcohol Clin Exp Res. 2019 Nov.

Abstract

Background: Prenatal alcohol exposure (PAE) causes long-term growth and neurodevelopmental deficits that are worsened by maternal iron deficiency (ID). In our preclinical rat model, PAE causes fetal anemia, brain ID, and elevated hepatic iron via increased maternal and fetal hepcidin synthesis. These changes are normalized by a prenatal iron-fortified (IF) diet. Here, we hypothesize that iron status and PAE dysregulate the major upstream pathways that govern hepcidin production-EPO/BMP6/SMAD and IL-6/JAK2/STAT3.

Methods: Pregnant, Long Evans rat dams consumed ID (2 to 6 ppm iron), iron-sufficient (IS, 100 ppm iron), or IF (500 ppm iron) diets and received alcohol (5 g/kg) or isocaloric maltodextrin daily from gestational days (GD) 13.5 to 19.5. Protein and gene expression were quantified in the 6 experimental groups at GD 20.5.

Results: PAE did not affect Epo or Bmp6 expression, but reduced p-SMAD1/5/8/SMAD1/5/8 protein ratios in both IS and ID maternal and fetal liver (all p's < 0.01). In contrast, PAE stimulated maternal hepatic expression of Il-6 (p = 0.03) and elevated p-STAT3/STAT3 protein ratios in both IS and ID maternal and fetal liver (all p's < 0.02). PAE modestly elevated maternal Il-1β, Tnf-α, and Ifn-γ. Fetal cytokine responses to PAE were muted compared with dams, and PAE did not affect hepatic Il-6 (p = 0.78) in IS and ID fetuses. Dietary iron fortification sharply attenuated Il-6 expression in response to PAE, with IF driving a 150-fold decrease (p < 0.001) in maternal liver and a 10-fold decrease (p < 0.01) in fetal liver. The IF diet also normalized p-STAT3/STAT3 ratios in both maternal and fetal liver.

Conclusions: These findings suggest that alcohol-driven stimulation of the IL-6/JAK2/STAT3 pathway mediates the elevated hepcidin observed in the PAE dam and fetus. Normalization of these signals by IF suggests that dysregulated hepcidin is driven by alcohol's disruption of the IL-6/JAK2/STAT3 pathway. Prenatal dietary IF represents a potential therapeutic approach for PAE that warrants further investigation.

Keywords: Fetal Alcohol Spectrum Disorder; Hepcidin; IL-6; Iron Deficiency; Iron Fortification.


Figures

Figure 1:
Figure 1:. In dam, PAE elevated activity of JAK2/STAT3 pathway but did not affect EPO/BMP6/SMAD pathway.
(A) Neither PAE nor iron deficiency affected maternal kidney erythropoietin expression. (B) Similarly, PAE did not affect hepatic Bmp6 expression, whereas Bmp6 significantly declined in response to ID. (C) Both PAE and ID reduced the abundance of p-SMAD1/5/8 protein relative to total SMAD1/5/8, whereas (D) they elevated p-STAT3 abundance relative to total STAT3 protein. Bar graphs are means ± SEMs. Individual dots in panels A and B represent mean measurements of individual maternal kidneys and livers. N = 3–5 individuals per treatment for Epo measurement, N = 5 individuals per treatment for Bmp6, N = 6 individuals per treatment for p-SMAD1/5/8, and N = 6–9 individuals per treatment for p-STAT3. Figure panels depict overall P-values as determined by a 2-factor ANOVA (for normal data with equal variance) or Kruskal-Wallis test (for non-normal data and/or data with unequal variance). Post hoc analysis by Tukey’s test (for normal data with equal variance) or Wilcoxon rank-sum test (for non-normal data and/or data with unequal variance) depict means that are significantly different when they do not share a common letter, P<0.05. Data lacked outliers as determined by Grubb’s test. IS, iron-sufficient; ID, iron-deficient; M, maltodextrin; PAE, prenatal alcohol exposure.
Figure 2:
Figure 2:. PAE elevated pro-inflammatory cytokine expression in maternal liver.
PAE elevated Il-6 (A) and Il-1β (B) expression and trended toward increasing Tnf-α (C) and Ifn-γ (D) expression. Iron deficiency did not appreciably affect pro-inflammatory cytokines in maternal liver, except for lowering Il-6 and Tnf-α expression. Bar graphs are means ± SEMs of cytokine expression, and the individual dots represent mean measurements of individual maternal livers. N = 5 dams per treatment. Statistics were conducted as in Figure 1. Means are significantly different when they do not share a common letter, P<0.05. Data lacked outliers as determined by Grubb’s test. IS, iron-sufficient; ID, iron-deficient; M, maltodextrin; PAE, prenatal alcohol exposure.
Figure 3:
Figure 3:. In fetus, PAE elevated activity of JAK2/STAT3 pathway but did not affect EPO/BMP6/SMAD pathway.
(A) Neither PAE nor iron deficiency affected fetal hepatic Epo expression. (B) PAE did not affect Bmp6 expression, whereas ID elevated Bmp6. (C) Both PAE and ID reduced p-SMAD1/5/8 protein relative to total SMAD1/5/8, whereas (D) they elevated p-STAT3 protein relative to total STAT3. Bar graphs are means ± SEMs. Individual dots in panels A and B represent mean measurements within individual fetal livers. N = 2 fetuses per litter and 4 litters per treatment group for Epo and Bmp6 expression measurements, N = 2 fetuses per litter and 3 litters per treatment group for p-SMAD1/5/8 and p-STAT3 measurements. Statistics were conducted as in Figure 1. Means are significantly different when they do not share a common letter, P<0.05. Data lacked outliers as determined by Grubb’s test. IS, iron-sufficient; ID, iron-deficient; M, maltodextrin; PAE, prenatal alcohol exposure.
Figure 4:
Figure 4:. PAE and iron deficiency had a minimal effect on pro-inflammatory cytokine expression in fetal liver.
(A) Neither PAE nor iron deficiency significantly altered fetal Il-6 expression. However, PAE elevated expression of Il-1β (B) and Tnf-α (C). ID had little impact upon fetal cytokine expression. Bar graphs are means ± SEMs. Individual dots represent mean measurements within individual fetal livers. N = 2 fetuses per litter and 6 litters per treatment. Statistics were conducted as in Figure 1. Means are significantly different when they do not share a common letter, P<0.05. Grubb’s test detected 1 outlier in the ID-M group of Il-1β and 1 outlier each in the ID-PAE and IS-PAE groups of Il-6 which were excluded from the graphs and statistical analyses. IS, iron-sufficient; ID, iron-deficient; M, maltodextrin; PAE, prenatal alcohol exposure.
Figure 5:
Figure 5:. PAE and iron deficiency had minimal impacts on pro-inflammatory cytokine expression in fetal brain.
(A) Neither PAE nor iron deficiency significantly altered fetal brain Il-6 expression. (B) PAE and ID individually elevated Il-1β expression and interacted to increase its expression. (C) PAE elevated Tnf-α expression, whereas ID did not affect expression. (D) PAE and ID did not affect expression of Ifn-γ. Bar graphs are means ± SEMs. Individual dots represent mean measurements within individual fetal brains. N = 2 fetuses per litter and 5 litters per treatment group. Statistics were conducted as in Figure 1. Means are significantly different when they do not share a common letter, P<0.05. Grubb’s test detected 1 outlier each in ID-M, ID-PAE, and IS-PAE groups in Ifn-γ and 1 outlier each in ID-PAE and IS-PAE groups in Il-6. These outliers were excluded from the graphs and statistical analyses. IS, iron-sufficient; ID, iron-deficient; M, maltodextrin; PAE, prenatal alcohol exposure.
Figure 6:
Figure 6:. Dietary iron fortification mitigated pro-inflammatory cytokines induced by PAE.
Dietary iron fortification (IF) mitigated the elevation of Il-6 (A), Il-1β (B), Tnf-α (C), and Ifn-γ (D) expression in maternal livers exposed to PAE. IF reduced pro-inflammatory cytokines even in the absence of PAE. Values for IS-M and IS-PAE are reproduced from Figure 2, as those data were generated simultaneously. Bar graphs are means ± SEMs, and individual dots represent mean measurements of individual maternal livers. N = 5 dams per treatment. Statistics were conducted as in Figure 1. Means are significantly different when they do not share a common letter, P<0.05. Data lacked outliers as determined by Grubb’s test. IS, iron-sufficient; IF, iron-fortified; M, maltodextrin; PAE, prenatal alcohol exposure.
Figure 7:
Figure 7:. Maternal dietary iron fortification selectively reduced Il-6 expression in response to PAE in fetal liver.
(A) Dietary iron fortification mitigated the elevation in Il-6 expression caused by PAE in fetal liver. (B,C) Dietary iron fortification did not significantly affect fetal hepatic expression of Il-1β or Tnf-α. Bar graphs are means ± SEMs of cytokine expression, and the individual dots represent mean measurements within individual fetal livers. N = 2 fetuses per litter and 4 litters per treatment group. Statistics were conducted as in Figure 1. Means are significantly different when they do not share a common letter, P<0.05. Data lacked outliers as determined by Grubb’s test. IS, iron-sufficient; IF, iron-fortified; M, maltodextrin; PAE, prenatal alcohol exposure.
Figure 8:
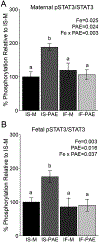
Figure 8:. In dams and fetuses, maternal dietary iron fortification mitigated the elevated STAT3 in response to PAE.
PAE elevated p-STAT3 in maternal (A) and fetal (B) livers, and IF normalized p-STAT3 levels to IS-M control levels, even in the presence of PAE. Values for IS-M and IS-PAE are reproduced from Figures 1D (maternal) and 3D (fetal), as these data were generated simultaneously. Bar graphs are means ± SEMs. For maternal data, N = 7–9 individual animals for IS measurements and N= 4 individual animals for IF measurements. For fetal data, N=2 fetuses per litter/6 litters for IS measurements and N=2 fetuses per litter/3 litters for IF measurements. The protein quantification of maternal and fetal IF-M and IF-PAE p-STAT3/STAT3 is represented relative to IS-M p-STAT3/STAT3 abundance from Figures 1 and 3 after normalization to GAPDH abundance within the same lane. Statistics were conducted as in Figure 1. Means are significantly different when they do not share a common letter, P<0.05. Data lacked outliers as determined by Grubb’s test. IS, iron-sufficient; IF, iron-fortified; M, maltodextrin; PAE, prenatal alcohol exposure.
Figure 9:
Figure 9:. PAE elevated maternal Il-10 expression but does not affect fetal Il-10 expression.
(A) PAE elevated Il-10 expression in maternal liver in both IS and ID dams, while dietary iron fortification lowered Il-10 expression. (B) PAE had a minimal impact on fetal Il-10 expression. Bar graphs are means ± SEMs of cytokine expression, and the individual dots represent mean measurements within individual maternal or fetal livers. N = 5 dams per treatment group in panel A. N = 2 fetuses per litter and 4 litters per treatment group in panel B. Statistics were conducted as in Figure 1. Means are significantly different when they do not share a common letter, P<0.05. Data lacked outliers as determined by Grubb’s test. IS, iron-sufficient; IF, iron-fortified; M, maltodextrin; PAE, prenatal alcohol exposure.

References

    1. Ahluwalia B, Wesley B, Adeyiga O, Smith DM, Da-Silva A, Rajguru S (2000) Alcohol modulates cytokine secretion and synthesis in human fetus: an in vivo and in vitro study. Alcohol 21:207–213. - PubMed
    1. Alwan N, Hamamy H (2015) Maternal Iron Status in Pregnancy and Long-Term Health Outcomes in the Offspring. J Pediatr Genet 4:111–123. - PMC - PubMed
    1. Anderson GJ, Frazer DM (2017) Current understanding of iron homeostasis. Am J Clin Nutr 1S–8S. - PMC - PubMed
    1. Bustin SA, Benes V, Garson JA, Hellemans J, Huggett J, Kubista M, Mueller R, Nolan T, Pfaffl MW, Shipley GL, Vandesompele J, Wittwer CT (2009) The MIQE Guidelines : Minimum Information for Publication of Quantitative Real-Time PCR Experiments. Clin Chem 55:1–12. - PubMed
    1. Carter RC, Jacobson JL, Molteno CD, Jiang H, Meintjes EM, Jacobson SW, Duggan C (2012) Effects of Heavy Prenatal Alcohol Exposure and Iron Deficiency Anemia on Child Growth and Body Composition through Age 9 Years. Alcohol Clin Exp Res 36:1973–1982. - PMC - PubMed

Publication types

Associated data