. 2018 Sep 3;215(9):2379-2395.
doi: 10.1084/jem.20172168. Epub 2018 Jul 30.

ARID5B regulates metabolic programming in human adaptive NK cells

Affiliations

ARID5B regulates metabolic programming in human adaptive NK cells

Frank Cichocki et al. J Exp Med. .

Abstract

Natural killer (NK) cells with adaptive immunological properties expand and persist in response to human cytomegalovirus. Here, we explored the metabolic processes unique to these cells. Adaptive CD3-CD56dimCD57+NKG2C+ NK cells exhibited metabolic hallmarks of lymphocyte memory, including increased oxidative mitochondrial respiration, mitochondrial membrane potential, and spare respiratory capacity. Mechanistically, we found that a short isoform of the chromatin-modifying transcriptional regulator, AT-rich interaction domain 5B (ARID5B), was selectively induced through DNA hypomethylation in adaptive NK cells. Knockdown and overexpression studies demonstrated that ARID5B played a direct role in promoting mitochondrial membrane potential, expression of genes encoding electron transport chain components, oxidative metabolism, survival, and IFN-γ production. Collectively, our data demonstrate that ARID5B is a key regulator of metabolism in human adaptive NK cells, which, if targeted, may be of therapeutic value.


Figures

None
Graphical abstract
Figure 1.
Figure 1.
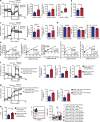
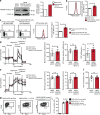
Adaptive NK cells exhibit heightened glycolysis and mitochondrial oxidative metabolism. (a) Metabolic functions in freshly isolated NK cells from five HCMV-seropositive and five HCMV-seronegative donors were analyzed by Seahorse. Shown are OCR profiles for representative donors and averages for maximal respiration, ATP-linked respiration, and SRC. (b) Quantification of ATP in NK cells from four seronegative and four seropositive donors. (c) ECAR profiles for representative donors and averages for maximal glycolysis and glycolytic reserve. (d) NK cells were isolated from five seronegative and five seropositive donors and incubated with the indicated inhibitors for 10 min before lysis and ATP quantification. Shown are fold decreases in ATP for each inhibitor relative to vehicle controls. (a–d) Results are from two independent experiments. (e) Associations between Seahorse metabolic readouts and the percentages of adaptive NK cells. Unpaired Student’s t tests were used to determine statistical significance. (f) Adaptive and canonical NK cells from three seropositive donors were sorted and analyzed by Seahorse. Shown is the OCR profile from a representative donor and averages for maximal respiration, ATP-linked respiration, and SRC. (g) Shown is the ECAR profile of canonical and adaptive NK cells from a representative donor, as well as the averages for maximal glycolysis and glycolytic reserve. All OCR and ECAR results are from two independent experiments. (h) Quantification of ATP in sorted canonical NK cells and adaptive NK cells from five seropositive donors. (i) Measurement of glucose uptake using 2-NBDG in isolated NK cells from six seropositive donors at rest, after stimulation with an anti-CD16 antibody and after stimulation with PMA:ionomycin. Shown are the 2-NBDG mean fluorescence intensity (MFI) averages in gated canonical and adaptive NK cells in each condition. Results are from two independent experiments. Paired Student’s t tests were used to determine statistical significance. Error bars represent SEM. *P < 0.05, **P < 0.01. n.s., not significant.
Figure 2.
Figure 2.
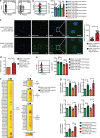
Adaptive NK cells have increased mitochondrial membrane potential and expression of ETC genes. (a) Representative FACS plots of CD57 and NKG2C on gated NK cells from seronegative and seropositive donors. (b) Representative histogram plots of MitoTracker staining within the indicated NK cell subsets (left) and cumulative data of MitoTracker MFI values from five seronegative donors and five seropositive donors (right). (c) Canonical and adaptive NK cells were sorted from two seropositive donors in two independent experiments, stained with MitoTracker and DAPI dyes, and analyzed by confocal microscopy. Shown are representative images from one donor (left) and cumulative MitoTracker intensity values from 18 canonical NK cells and 20 adaptive NK cells (right). Scale bars are 10 µm. a.u., arbitrary units. (d) qRT-PCR was used to determine the ratio of mitochondrial DNA to genomic DNA for canonical and adaptive NK cells. Results are from four donors in two independent experiments. (e) Representative FACS histogram plots of CellRox staining in the indicated subsets of NK cells from a HCMV-seropositive donor (left) and cumulative data of CellRox MFI values from six donors in two independent experiments (right). (f) The indicated subsets of canonical and adaptive NK cells were sorted from five seropositive donors in three independent experiments and used for RNA-seq analysis. Shown is a heat map of normalized fold-expression values for mitochondrial ATP synthase complex and ETC genes in canonical and adaptive NK cells. (g) The indicated subsets of canonical and adaptive NK cells were sorted from four seropositive donors in two independent experiments and used for qRT-PCR. All expression values were normalized against ACTB and against gene expression values from CD3CD56dimCD57NKG2C canonical NK cells. Error bars represent SEM. Paired Student’s t tests were used to determine statistical significance. *P < 0.05, **P < 0.01. n.s., not significant.
Figure 3.
Figure 3.
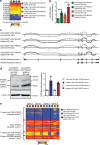
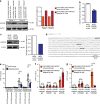
ARID5B expression is elevated in adaptive NK cells. (a) Shown is a heat map of average normalized expression of genes belonging to the ARID family from the RNA-seq dataset. (b) Cumulative qRT-PCR data of ARID5B mRNA expression in the indicated canonical and adaptive NK cell subsets sorted from three HCMV-seropositive donors. All expression values were normalized against ACTB, and fold-expression values were determined for each subset relative to CD3CD56dimCD57NKG2C canonical NK cells. Results are from two independent experiments. (c) Sashimi plots of RNA-seq data from a representative donor showing genomic alignments of RNA-seq reads and splice junctions within the ARID5B locus. (d) Canonical and adaptive NK cells were sorted from two seropositive donors in two independent experiments. Western blots were performed with antibodies against ARID5B and β-actin. Shown is a representative blot from one donor (left) and quantification by densitometry for both donors (right). (e) Methylation patterns throughout the ARID5B locus generated from whole-genome methylation profiling of the indicated canonical and adaptive NK cell populations sorted from four seropositive donors. Error bars represent SEM. Paired Student’s t tests were used to determine statistical significance. *P < 0.05.
Figure 4.
Figure 4.
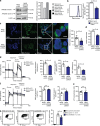
Knockdown of ARID5B leads to a decrease in mitochondrial membrane potential, oxidative mitochondrial metabolism, and IFN-γ production. NK-92 cells were transduced with an empty control pLKO.1 vector or a pLKO.1 vector containing an ARID5B-specific shRNA. (a) Western blot of ARID5B and β-actin in the control and shARID5B NK-92 lines (left) and quantification by densitometry (right). (b) Representative FACS plots (left) and cumulative fold differences in MitoTracker MFI values (right) from each indicated NK-92 cell line. Experiments were replicated twice. (c) The indicated NK-92 cell lines were stained with DAPI and MitoTracker dyes and visualized by confocal microscopy. Shown are representative images (left) and cumulative MitoTracker intensity values calculated from 11 individual cells (right). Scale bars are 10 µm. Results are from two independent replicates, with similar results observed in both experiments. a.u., arbitrary units. (d) qRT-PCR was used to determine the ratio of mitochondrial DNA to genomic DNA for each indicated NK-92 cell line. Results are from three independent replicates. (e) OCR profiles of the control and shARID5B NK-92 cell lines in a representative experiment and averages for maximal respiration, ATP-linked respiration, and SRC. (f) ECAR profiles for the indicated NK-92 cell lines in a representative experiment and averages for maximal glycolysis and glycolytic reserve. All cumulative OCR and ECAR results were replicated twice. (g) Quantification of ATP in control and shARID5B cell lines. (h) Control and shARID5B NK-92 cells were cultured overnight with and without IL-12 and IL-18 before FACS analysis of NK cell functional readouts. Representative FACS plots and cumulative data of the frequencies of IFN-γ expression by NK-92 cells are shown. (g and h) Experiments were replicated twice. Error bars represent SEM. Paired Student’s t tests were used to determine statistical significance. *P < 0.05, **P < 0.01. n.s., not significant.
Figure 5.
Figure 5.
Knockdown of ARID5B leads to reduced survival and expression of the pro-survival protein BCL-2. (a) Cell cycle analysis of control and shARID5B NK-92 cells by propidium iodide staining (PI). Shown are representative FACS plots for both NK-92 lines (left) and cumulative data of the percentages of cells in each cell cycle phase (right). Experiments were replicated twice. (b) Control and shARID5B NK-92 cells were plated at equal numbers, and viable cell counts were taken after 2 and 3 d in culture. Shown is cumulative fold expansion data for both lines. Results are from four replicates in two independent experiments. (c) Control and shARID5B NK-92 cells were stained with annexin V and propidium iodide and analyzed by flow cytometry. Shown are representative FACS plots gated on lymphocytes (left) and cumulative fold differences (right). (d) Western blot of BCL-2 in control and shARID5B NK-92 cells. Shown is a representative blot (left) and fold decrease in shARID5B NK-92 cells calculated by densitometry (right). (c and d) Experiments were replicated twice. Error bars represent SEM. Paired Student’s t tests were used to determine statistical significance. *P < 0.05, **P < 0.01. n.s., not significant.
Figure 6.
Figure 6.
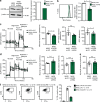
Overexpression of ARID5B results in increases in mitochondrial membrane potential, oxidative mitochondrial metabolism, and IFN-γ production. NK-92 cells were transduced with a control pCDH vector containing GFP or a pCDH vector containing GFP and ARID5B variant 2. (a) Western blot of ARID5B variant 2 and β-actin in each sorted GFP+ NK-92 cell line (left) and image quantification by densitometry (right). (b) Mitochondrial membrane potentials were determined by MitoTracker staining and FACS analysis in sorted GFP+ cells from the control and ARID5B variant 2 overexpression NK-92 lines. Cumulative data of the relative fold difference in MitoTracker staining between vectors are shown (right). Experiments were replicated twice. (c) Primary NK cells were transduced with the control or the ARID5B variant 2 overexpression vectors. Cells were analyzed for GFP expression and mitochondrial mass 72 h after transduction. Shown are representative FACS plots of GFP against forward scatter (FSC) in gated NK cells and MitoTracker histogram plots (left). Cumulative data from four donors of the relative fold difference in MitoTracker staining between vectors are also shown (right). Results are from two independent experiments. Similar results were observed in both experiments. (d) OCR profiles of the control and ARID5B variant 2–overexpressing NK-92 cell lines in a representative experiment and averages for maximal respiration, ATP-linked respiration, and SRC. (e) ECAR profiles for the indicated NK-92 cell lines in a representative experiment and averages for maximal glycolysis and glycolytic reserve. OCR and ECAR experiments were replicated twice. (f) Quantification of ATP in control and ARID5B-overexpressing cell lines in three independent replicates. (g) Control and ARID5B-overexpressing NK-92 cells were cultured overnight with and without IL-12 and IL-18 before FACS analysis. Representative FACS plots and cumulative data of the frequencies of IFN-γ expression by NK-92 cells are shown. Experiments were replicated twice. Error bars represent SEM. Paired Student’s t tests were used to determine statistical significance. *P < 0.05. n.s., not significant.
Figure 7.
Figure 7.
ARID5B directly regulates UQCRB expression. (a) Canonical and adaptive NK cells were sorted from two HCMV-seropositive donors and used for Western blot analysis of UQCRB (left). Quantification by densitometry and determination of fold difference is shown (right). (b) Determination of relative UQCRB mRNA in control versus shARID5B NK-92 cells by qRT-PCR. Results are from three independent experiments. (c) Western blot of UQCRB in the control and ARID5B knockdown NK-92 lines (left) and relative UQCRB expression calculated by densitometry (right). (d) Shown is the sequence of the upstream proximal promoter region of UQCRB. Putative core binding sites for ARID5B are highlighted in bold. The transcriptional start site (TSS) for UQCRB is also indicated. (e) Control and shARID5B NK-92 cells were used in ChIP assays to assess polymerase II and ARID5B binding to a control region far upstream of UQCRB (-1,728 bp) and to the proximal UQCRB promoter (-351 bp). The ChIP assays were repeated five times in three independent experiments. Results are shown as the percentage of input. (f) Canonical and adaptive NK cells were sorted from three HCMV-seropositive donors. Sorted cells were used in ChIP assays to assess ARID5B binding to the control region far upstream of UQCRB (-1,728 bp) and to the proximal UQCRB promoter (-351 bp). Results are from two independent experiments. (g) Canonical and adaptive NK cells were sorted from three HCMV-seropositive donors. ChIP assays were performed to assess H3K9Me2 levels in the control region far upstream of UQCRB and within the proximal UQCRB promoter. Control isotype IgG antibody was included in all assays as a control for nonspecific binding. Results are from two independent experiments. Error bars represent SEM. Paired Student’s t tests were used to determine statistical significance. *P < 0.05. n.s., not significant.
Figure 8.
Figure 8.
Knockdown of UQCRB leads to a decrease in mitochondrial membrane potential, oxidative mitochondrial metabolism, and IFN-γ production. NK-92 cells were transduced with an empty vector or a pLKO.1 vector containing UQCRB-specific shRNA. (a) Western blot of UQCRB and β-actin in the control and shUQCRB NK-92 lines (left) and quantification by densitometry (right). (b) Representative FACS plots (left) and cumulative fold differences in MitoTracker MFI values (right) from each indicated NK-92 cell line. Experiments were replicated twice. (c) OCR profiles of the control and shARID5B NK-92 cell lines in a representative experiment and averages for maximal respiration, ATP-linked respiration, and SRC. (d) ECAR profiles for the indicated NK-92 cell lines in a representative experiment and averages for maximal glycolysis and glycolytic reserve. All cumulative OCR and ECAR results were replicated twice. (e) Quantification of ATP in control and shUQCRB cell lines. (f) Control and shUQCRB NK-92 cells were cultured overnight with and without IL-12 and IL-18 before FACS analysis of NK cell functional readouts. Shown are representative FACS plots and cumulative data of the frequencies of IFN-γ expression by NK-92 cells. (e and f) Experiments were replicated twice. Error bars represent SEM. Paired Student’s t tests were used to determine statistical significance. *P < 0.05. n.s., not significant.

References

    1. Baba A., Ohtake F., Okuno Y., Yokota K., Okada M., Imai Y., Ni M., Meyer C.A., Igarashi K., Kanno J., et al. . 2011. PKA-dependent regulation of the histone lysine demethylase complex PHF2-ARID5B. Nat. Cell Biol. 13:668–675. 10.1038/ncb2228 - DOI - PubMed
    1. Bantug G.R., Fischer M., Grählert J., Balmer M.L., Unterstab G., Develioglu L., Steiner R., Zhang L., Costa A.S.H., Gubser P.M., et al. . 2018. Mitochondria-Endoplasmic Reticulum Contact Sites Function as Immunometabolic Hubs that Orchestrate the Rapid Recall Response of Memory CD8+ T Cells. Immunity. 48:542–555.e6. 10.1016/j.immuni.2018.02.012 - DOI - PMC - PubMed
    1. Buck M.D., O’Sullivan D., Klein Geltink R.I., Curtis J.D., Chang C.H., Sanin D.E., Qiu J., Kretz O., Braas D., van der Windt G.J., et al. . 2016. Mitochondrial Dynamics Controls T Cell Fate through Metabolic Programming. Cell. 166:63–76. 10.1016/j.cell.2016.05.035 - DOI - PMC - PubMed
    1. Champagne D.P., Hatle K.M., Fortner K.A., D’Alessandro A., Thornton T.M., Yang R., Torralba D., Tomás-Cortázar J., Jun Y.W., Ahn K.H., et al. . 2016. Fine-Tuning of CD8(+) T Cell Mitochondrial Metabolism by the Respiratory Chain Repressor MCJ Dictates Protection to Influenza Virus. Immunity. 44:1299–1311. 10.1016/j.immuni.2016.02.018 - DOI - PMC - PubMed
    1. Cichocki F., Cooley S., Davis Z., DeFor T.E., Schlums H., Zhang B., Brunstein C.G., Blazar B.R., Wagner J., Diamond D.J., et al. . 2016. CD56dimCD57+NKG2C+ NK cell expansion is associated with reduced leukemia relapse after reduced intensity HCT. Leukemia. 30:456–463. 10.1038/leu.2015.260 - DOI - PMC - PubMed

Publication types

MeSH terms

Associated data