. 2004 Sep;2(9):E247.
doi: 10.1371/journal.pbio.0020247. Epub 2004 Jun 29.

Genomic analysis of mouse retinal development

Affiliations

Genomic analysis of mouse retinal development

Seth Blackshaw et al. PLoS Biol. 2004 Sep.

Abstract

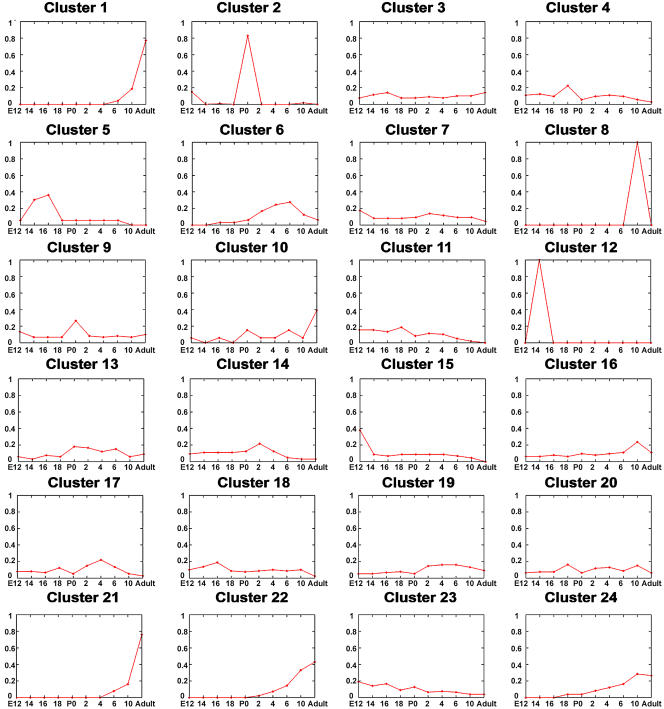
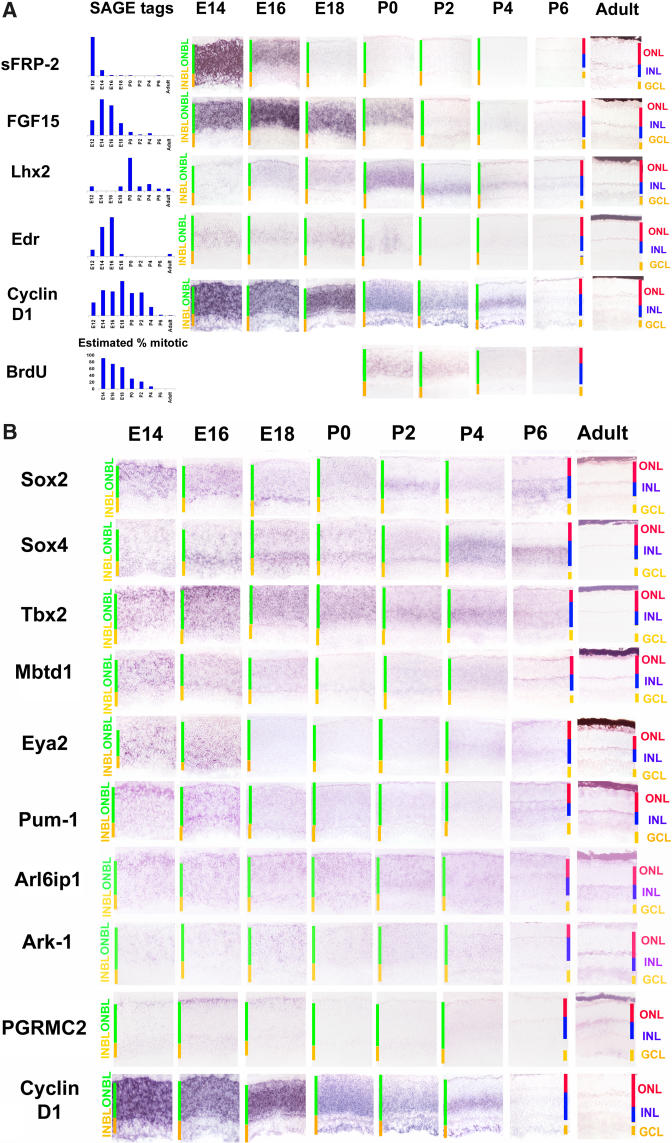
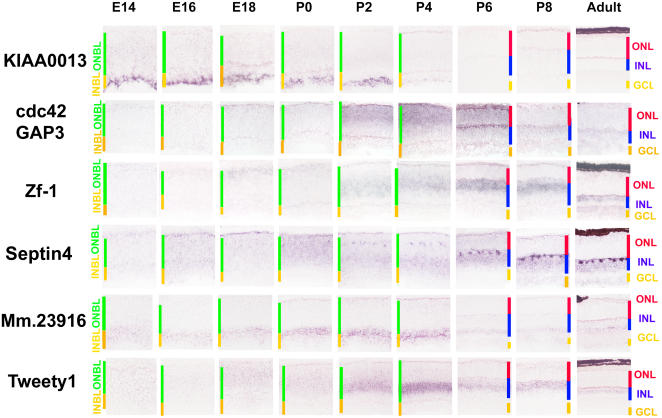
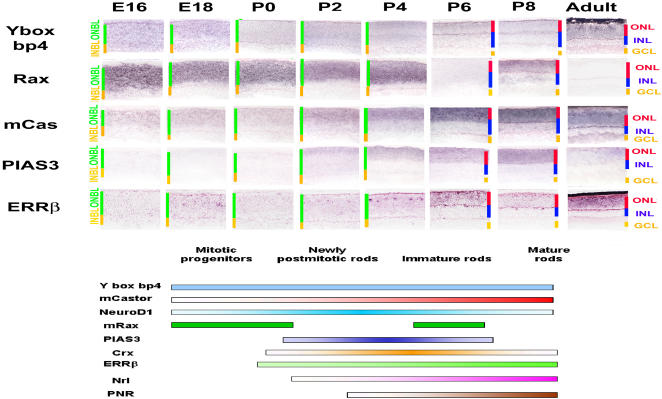
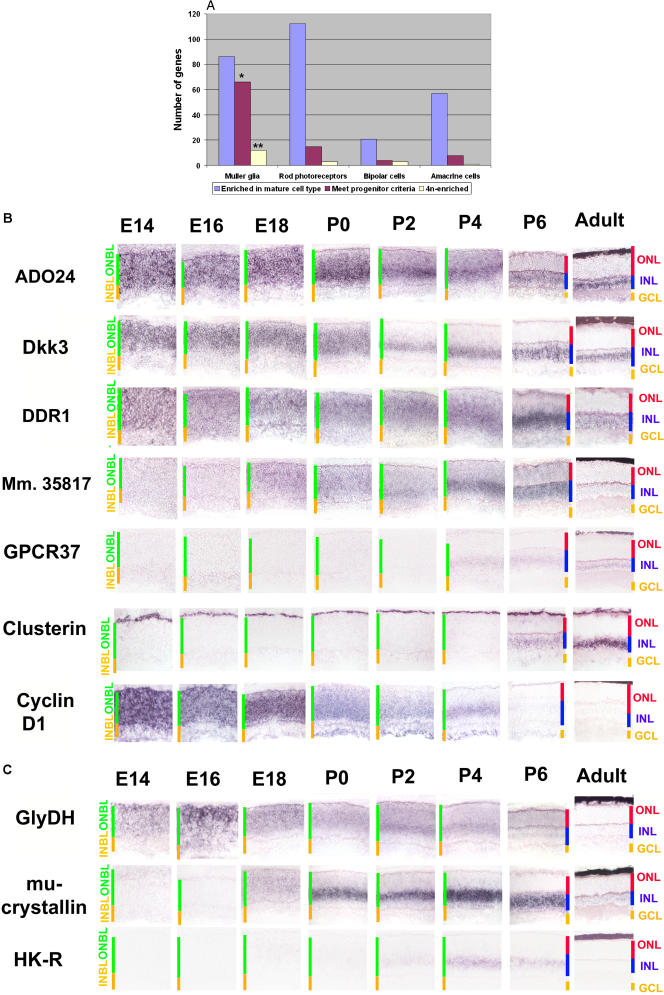
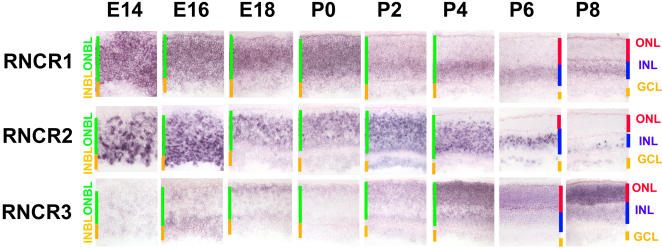
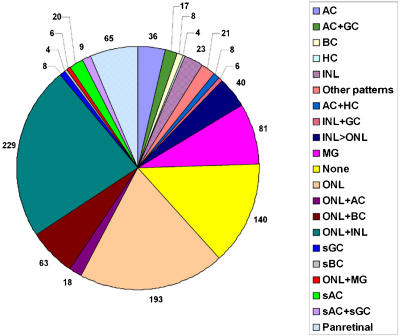
The vertebrate retina is comprised of seven major cell types that are generated in overlapping but well-defined intervals. To identify genes that might regulate retinal development, gene expression in the developing retina was profiled at multiple time points using serial analysis of gene expression (SAGE). The expression patterns of 1,051 genes that showed developmentally dynamic expression by SAGE were investigated using in situ hybridization. A molecular atlas of gene expression in the developing and mature retina was thereby constructed, along with a taxonomic classification of developmental gene expression patterns. Genes were identified that label both temporal and spatial subsets of mitotic progenitor cells. For each developing and mature major retinal cell type, genes selectively expressed in that cell type were identified. The gene expression profiles of retinal Müller glia and mitotic progenitor cells were found to be highly similar, suggesting that Müller glia might serve to produce multiple retinal cell types under the right conditions. In addition, multiple transcripts that were evolutionarily conserved that did not appear to encode open reading frames of more than 100 amino acids in length ("noncoding RNAs") were found to be dynamically and specifically expressed in developing and mature retinal cell types. Finally, many photoreceptor-enriched genes that mapped to chromosomal intervals containing retinal disease genes were identified. These data serve as a starting point for functional investigations of the roles of these genes in retinal development and physiology.


Conflict of interest statement

The authors have declared that no conflicts of interest exist.

Figures

Figure 1
Figure 1. Median Plot of SAGE Tag K-Means Cluster Analysis Using 24 Clusters
Tags present at greater than 0.1% in one or more of the ten wild-type total retina libraries are considered. SAGE libraries are plotted on the x-axis, and tag abundance, plotted as a fraction of the total tags for a gene in the library in question, is shown on the y-axis. A full list of tags and their abundance levels used for the analysis is detailed in Table S3.
Figure 2
Figure 2. Genes Expressed in Subsets of Mitotic Progenitors
(A) Genes expressed in temporally distinct subsets of progenitors. The first column shows relative SAGE tag levels for each gene under consideration. The UniGene identities and common names of the genes in question are Mm.19155/sFrp2, Mm.3904/Fgf15, Mm.142856/Lhx2, Mm.35829/Edr, and Mm.22288/cyclin D1. The sections for ISH and BrdU shown here were taken from near the center of the retina at the developmental times shown. Mice were albino Swiss Websters except in the case of the adults, which were pigmented C57B/6. See Table S5 for a full list of probes used. Cellular laminae of both the developing and mature retina are indicated with colored bars. All pictures were taken at 200x. The graph plotting the fraction of mitotic cells in the retina adjacent to the BrdU staining is an estimate based on data from both rat and mouse (Young 1985a, b; Alexiades and Cepko. 1996). (B) Spatially heterogeneous ONBL. Genes that were expressed in spatial subsets of cells in the prenatal ONBL are shown. The genes shown are Mm.4541/Sox2, Mm.18789/Sox4, Mm.4605/Tbx2, Mm.29067/Mbtd1, Mm.2229/Eya2, Mm.34701/Pum1, Mm.29924/Arl6ip1, Mm.11738/Ark-1, Mm.40321/Pgrmc2, and Mm.22288/cyclin D1. Sections were from central retina. Cellular laminae of both the developing and mature retina are indicated with colored bars. All pictures were taken at 200x. See Table S5 for a full list of probes used.
Figure 3
Figure 3. Precursor Patterns for Major Retinal Cell Types
Genes that are selectively expressed in immature subtypes of retinal cells. From the top, the differentiating cell types that express the genes in question are ganglion cells (Mm.45753/KIAA0013), rod photoreceptors (Mm.103742/Cdc42GAP), bipolar cells (Mm.29496/Zf-1), horizontal cells (Mm.2214 /septin 4), amacrine cells (Mm.23916), and Müller glia (Mm.29729/Tweety1). Sections were from central retina. Cellular laminae of both the developing and mature retina are indicated with colored bars. All pictures were taken at 200x. See Table S5 for a full list of probes used.
Figure 4
Figure 4. Transcription Factor Cascade in Photoreceptor Development
Transcription factors that are selectively expressed in developing rods (and possibly cones as well) are shown. The schematic diagram integrates gene expression data from previously identified photoreceptor-enriched transcription factors and from genes explored in this study. The genes shown are Mm.193526/Yboxbp4, Mm.3499/Rax, Mm. 89623/mCas, Mm.1635/PIAS3, and Mm.235550/ERRβ. See Figure S6 for images of the developmental expression patterns of previously characterized transcription factors. Sections were from central retina. Cellular laminae of both the developing and mature retina are indicated with colored bars. All pictures were taken at 200x. See Table S5 for a full list of probes used.
Figure 5
Figure 5. Müller-Glia-Enriched Genes
(A) Müller-glia-enriched genes show stronger expression in retinal progenitors than do genes enriched in other postnatally born cell types. See Materials and Methods for details of how progenitor-enriched and cell-specific expression patterns were determined, and p-values for progenitor-enrichment of genes that are cell type–specific in the mature retina were calculated. Data on 4N-enriched transcripts were obtained from Livesey et al. (2004). Numbers for each value are as follows. For N, the number of cell-enriched genes, N MG = 86, N Pr = 112, N BC = 21, and N AC = 57. For I, the number of genes that show retinal progenitor-enriched patterns by ISH, I total = 180, I MG = 66, I PR = 15, I BC = 4, and I AC = 8. For M, the number of genes enriched in 4N retinal progenitor cells that were tested by ISH in adult retina, M total = 28, M MG = 12, M PR = 3, M BC = 3, and M AC = 1. *, p < 10−13; **, p < 0.0001. (B) Müller-glia-enriched genes show strong expression in mitotic progenitors. The genes shown are: Mm.26062/ADO24, Mm.55143/Dkk3, Mm.5021/DDR1, Mm.35817, Mm.20465/GPCR37, Mm.200608/clusterin, and Mm.22288/cyclin D1. Sections were from central retina. Cellular laminae of both the developing and mature retina are indicated with colored bars. All pictures were taken at 200x. See Table S5 for a full list of probes used. (C) Dynamic expression of metabolic genes in developing retina. Metabolic enzymes are often selectively expressed in mitotic progenitors and developing Müller glia. The genes shown are Mm.27953/glycine decarboxylase, Mm.9114/mu-crystallin, and Mm.213213/HK-R. Cellular laminae of both the developing and mature retina are indicated with colored bars. Sections were from central retina. All pictures were taken at 200x. See Table S5 for a full list of probes used.
Figure 6
Figure 6. Noncoding RNAs in Retinal Development
A number of presumptive noncoding RNAs are strongly expressed in dynamic subsets of retinal progenitor and precursor cells. The transcripts shown are Mm.150838/ RNCR1, Mm.44854/ RNCR2, and Mm.194050/RNCR3. Sections were from central retina. Cellular laminae of both the developing and mature retina are indicated with colored bars. All pictures were taken at 200x. See Table S5 for a full list of probes used.
Figure 7
Figure 7. Catalog of Gene Expression in Adult Retina
The most commonly observed patterns of gene expression in the adult retina are indicated. Data are taken from Table S5 and cover all genes examined in the adult retina. Genes are placed in a category corresponding to a single cell type if expression is substantially greater in that cell type than in any of the other cell types examined. Genes are placed in categories corresponding to multiple cell types if expression is approximately equal in more than one cell type. The number of genes expressed in photoreceptors and Müller glia differs somewhat from those used in the analysis shown in Figure 5A, since the expression of a large number of photoreceptor-enriched genes was not examined prenatally, and a number of Müller-enriched genes were detectable in Müller glia through the end of the second postnatal week, but not in adult retina. AC, amacrine cells; BC, bipolar cells; GC,ganglion cells; HC, horizontal cells; MG, Müller glia; sAC, subset of amacrine cells; sBC, subset of bipolar cells; sGC, subset of ganglion cells

References

    1. Alexiades MR, Cepko CL. Quantitative analysis of proliferation and cell cycle length during development of the rat retina. Dev Dyn. 1996;205:293–307. - PubMed
    1. Alexiades MR, Cepko CL. Subsets of retinal progenitors display temporally regulated and distinct biases in the fates of their progeny. Development. 1997;124:1119–1131. - PubMed
    1. Altshuler D, Lo Turco JJ, Rush J, Cepko C. Taurine promotes the differentiation of a vertebrate retinal cell type in vitro. Development. 1993;119:1317–1328. - PubMed
    1. Anderson DJ. Lineages and transcription factors in the specification of vertebrate primary sensory neurons. Curr Opin Neurobiol. 1999;9:517–524. - PubMed
    1. Austin CP, Feldman DE, Ida JA, Cepko CL. Vertebrate retinal ganglion cells are selected from competent progenitors by the action of Notch. Development. 1995;121:3637–3650. - PubMed

Publication types

MeSH terms

Associated data