Multicenter Study
. 2024 Apr 17;16(743):eadj5154.
doi: 10.1126/scitranslmed.adj5154. Epub 2024 Apr 17.

Host-microbe multiomic profiling reveals age-dependent immune dysregulation associated with COVID-19 immunopathology

Collaborators, Affiliations
Multicenter Study

Host-microbe multiomic profiling reveals age-dependent immune dysregulation associated with COVID-19 immunopathology

Hoang Van Phan et al. Sci Transl Med. .

Abstract

Age is a major risk factor for severe coronavirus disease 2019 (COVID-19), yet the mechanisms behind this relationship have remained incompletely understood. To address this, we evaluated the impact of aging on host immune response in the blood and the upper airway, as well as the nasal microbiome in a prospective, multicenter cohort of 1031 vaccine-naïve patients hospitalized for COVID-19 between 18 and 96 years old. We performed mass cytometry, serum protein profiling, anti-severe acute respiratory syndrome coronavirus 2 (SARS-CoV-2) antibody assays, and blood and nasal transcriptomics. We found that older age correlated with increased SARS-CoV-2 viral abundance upon hospital admission, delayed viral clearance, and increased type I interferon gene expression in both the blood and upper airway. We also observed age-dependent up-regulation of innate immune signaling pathways and down-regulation of adaptive immune signaling pathways. Older adults had lower naïve T and B cell populations and higher monocyte populations. Over time, older adults demonstrated a sustained induction of pro-inflammatory genes and serum chemokines compared with younger individuals, suggesting an age-dependent impairment in inflammation resolution. Transcriptional and protein biomarkers of disease severity differed with age, with the oldest adults exhibiting greater expression of pro-inflammatory genes and proteins in severe disease. Together, our study finds that aging is associated with impaired viral clearance, dysregulated immune signaling, and persistent and potentially pathologic activation of pro-inflammatory genes and proteins.


Conflict of interest statement

Competing interests: F.K. has the following financial interests: The Icahn School of Medicine at Mount Sinai has filed patent applications relating to SARS-CoV-2 serological assays, NDV-based SARS-CoV-2 vaccines, influenza virus vaccines, and influenza virus therapeutics that list F.K. as coinventor [“Influenza Virus Vaccines and Uses Thereof (Chimeric HA 2),” 9,371,366; “Influenza Virus Vaccines and Uses Thereof (Chimeric HA 1),” 10,131,695; “Influenza Virus Vaccines and Uses Thereof (Chimeric HA 2),” 2934581; “Influenza Virus Vaccines and Uses Thereof (Chimeric HA 2),” 9,968,670; “Influenza Virus Vaccines and Uses Thereof (Chimeric HA2),” 10,137,189; “Influenza Virus Vaccines and Uses Thereof (Chimeric HA2),” 10,583,188; “Influenza Virus Vaccines and Uses Thereof (Chimeric HA 1),” EP2758075; “Influenza Virus Vaccination Regimens (Neuraminidase),” 10,736,956; “Anti-Influenza B Virus Neuraminidase Antibodies and Uses Thereof,” 11254733; and “Influenza Virus Hemagluttinin Proteins and Uses Thereof (Mosaic),” 7237344]. Mount Sinai has spun out a company, Kantaro, to market serological tests for SARS-CoV-2 and another company, Castlevax, to develop SARS-CoV-2 vaccines. F.K. is a cofounder and a scientific advisory board member of Castlevax. F.K. has consulted for Merck, Curevac, Seqirus, and Pfizer and is currently consulting for Third Rock Ventures, GSK, Gritstone, and Avimex. The Krammer laboratory is also collaborating with Dynavax on influenza vaccine development. S.K. receives consulting fees from Peraton. C.B.C. has received funding from the Bill & Melinda Gates Foundation for COVID-19 work paid to their institution; has received consulting fees from bioMerieux on clinical biomarkers; serves as DSMB, advisory board for Convalescent Plasma COVID-19 study for the National Heart, Lung and Blood Institute (NHLBI); and is acting leadership as president board of directors for the National Foundation of Emergency Medicine (NFEM), a nonprofit supporting emergency medicine research and researchers. C.S.C. has received grants from Bayer, Roche-Genentech, and Quantum Leap Healthcare Collaborative and has received consulting fees from Vasomune, Gen1e Life Sciences, Cellenkos, Arrowhead, Calcimedica, NGMBio, and Janssen. C.S.C. and C.R.L. are coinventors on a provisional patent filed by Regents of the University of California and the Chan Zuckerberg BioHub titled “Integrated Host-Microbe Metagenomics of Cell-Free Nucleic Acid for Sepsis Diagnosis,” application number 63/342,528. R.R.M. has a leadership counselor role from 2018 to 2021 for the Society of Leukocyte Biology. O.L. has received support as a speaker for a presentation regarding the coronavirus pandemic from the Mid-Size Bank Coalition of America (MBCA) and Moody’s Analytics. N.R. has research grants from Pfizer, Merck, Sanofi, Quidel, Immorna, Vaccine Company, and Lilly; serves on safety committees for ICON and EMMES and the advisory boards of Moderna, Seqirus, Pfizer, and Sanofi; and is a paid safety consultant for ICON, CyanVac, and EMMES. The other authors declare that they have no competing interests.

Figures

Fig. 1.
Fig. 1.. Older patients have more severe COVID-19 and greater SARS-CoV-2 viral abundance.
(A) Graphical study overview. This study evaluated 1031 patients with COVID-19 between the ages of 18 and 96 enrolled in the IMPACC cohort at 20 hospitals across the United States. (B) Age distribution of the participant cohort. (C and D) The box plot shows the relationship between patients’ age and TG severity (C) or mortality (D). In (C), n = 217, 270, 251, 191, and 102 patients in TG1 to TG5, respectively. In (D), n = 102 and 929 patients for the dead and surviving groups, respectively. (E) Nasal swab SARS-CoV-2 viral abundance at visit 1 (reads per million, or rpM, as measured by metatranscriptomics) in each age group (n = 191, 175, 205, 190, 212 patients in youngest to oldest age groups). in (C) to (E), the boxes indicate the first and third quartiles of the distributions, the boxes’ center lines indicate median values, and the whiskers indicate 1.5× the interquartile range below the first quartile and above the third quartile. (C to E) P values were calculated using the Kruskal-Wallis test to test whether the medians of all groups were the same. (F) Nasal swab SARS-CoV-2 viral abundance over time in each age group (n = 448, 451, 544, 507, 573 samples in youngest to oldest age groups). Each gray line connects longitudinal samples from the same patient. The black line indicates the generalized additive mixed-effects model fit in each age group. The P value was calculated for the interaction between days from admission and age groups with generalized additive mixed-effects modeling.
Fig. 2.
Fig. 2.. Aging alters immune cell populations during COVID-19.
(A) Uniform Manifold Approximation and Projection (UMAP) plot shows blood cell types analyzed by CyTOF (n = 643 patients). (B) Bar plot shows blood cell types that are increased (red) or decreased (blue) with age at visit 1. (C) Scatter plots depict centered log ratio (CLR)–transformed proportions of four example cell types against age. The red and blue lines indicate the linear fit, and the shaded regions indicate the 95% confidence intervals of the fits. P values were calculated using linear modeling with Benjamini-Hochberg correction.
Fig. 3.
Fig. 3.. Aging leads to changes in PBMC gene expression during COVID-19.
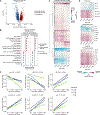
(A) Volcano plot highlights genes associated with age at visit 1 in PBMC RNA-seq data (n = 833 patients). (B) The dot plot demonstrates select Reactome pathways associated with age at visit 1, with (right) and without (left) controlling for SARS-CoV-2 viral abundance, in PBMC samples (data files S1 and S2). P values in (A) and (B) were calculated with the limma linear model and Benjamini-Hochberg correction. NF-κB, nuclear factor κB; RUNX3, run-related transcription factor 3. (C) Heatmap shows the longitudinal slopes (change in gene expression per day) of 2737 genes that significantly differ longitudinally between the five age groups (adjusted P < 0.05). n = 379, 384, 469, 449, and 485 samples in youngest to oldest groups. (D) Heatmaps show the longitudinal slopes of select MHC, inflammatory, and TCR signaling genes from (C). (E) Plots display the longitudinal dynamics of six example genes from (D). P values in (C) to (E) were calculated for the interaction term between days from admission and age groups using linear mixed-effects modeling and Benjamini-Hochberg correction. (Full longitudinal dynamics plots with confidence intervals are provided in fig. S7.)
Fig. 4.
Fig. 4.. Aging is associated with differences in serum inflammatory proteins during COVID-19.
(A) The bar plot highlights proteins that are significantly up-regulated (red) or down-regulated (blue) with age at visit 1 (adjusted P < 0.05). n = 895 patients. (B) Scatter plots show the normalized protein expression (NPX) of two representative proteins, CXCL9 and SIRT2, as a function of age. The red and blue lines indicate the linear fit, and the shaded regions indicate the 95% confidence intervals of the fits. (C) The dot plot represents the slope of cytokine expression versus viral abundance in the youngest and oldest age quintiles, 18 to 46 (n = 179 patients) and 71 to 96 (n = 198 patients), respectively. In (A) to (C), P values were calculated using linear regression and Benjamini-Hochberg correction. (D) Heatmap displays longitudinal slopes (change in protein expression per day) of all cytokines that display significant age-dependent longitudinal dynamics (adjusted P < 0.05). n = 412, 414, 456, 466, and 525 samples in the youngest to oldest age groups. (E) Plots show the longitudinal dynamics of four example cytokines from (D). P values in (D) and (E) were calculated for the interaction between days from admission and age groups using linear mixed-effects modeling and Benjamini-Hochberg correction.
Fig. 5.
Fig. 5.. Aging is associated with upper airway gene expression and changes to the nasal microbiome in COVID-19.
(A) Volcano plot shows genes associated with age at visit 1 in nasal samples (n = 915 patients). (B) Dot plots show select Reactome pathways associated with age at visit 1, with (right) and without (left) controlling for SARS-CoV-2 viral abundance. MYD88, myeloid differentiation primary response protein 88. (C) Bar plot displays cytokines predicted from nasal gene expression to be up-regulated with age by Ingenuity Pathway Analysis. (D) The scatter plot displays the Pearson’s correlation coefficient between PBMC expression and nasal expression of a gene in the youngest (x axis) and oldest (y axis) age quintiles. n = 155 and 170 patients in the youngest and oldest age groups, respectively. Fifty-two genes (black dots) have a strong correlation in both age groups (correlation coefficient, >0.5). (E) The dot plot shows correlations between SARS-CoV-2 and total bacterial relative abundance, ISG expression score, and TLR gene expression score. (F) The box plot shows Lawsonella relative abundance across the age quintiles. n = 198, 185, 215, 203, and 221 patients in the youngest to oldest age group. P values were calculated with a one-way analysis of variance (ANOVA) test and Benjamini-Hochberg correction. (G) Correlation between Lawsonella relative abundance and TLR gene expression across the age quintiles. P values were calculated using the test of association with Pearson’s correlation coefficient and Benjamini-Hochberg correction. (H) Percentages of cases with detected HSV or CMV transcripts in the youngest and oldest age quintiles. The number above each bar indicates the number of positive cases over the number of total samples. P values were calculated by Fisher’s exact test to compare the distribution of positive cases across six visits between the young and old age groups for HSV and separately for CMV.
Fig. 6.
Fig. 6.. Aging is associated with COVID-19 severity.
(A and B) The dot plots highlight select Reactome pathways in PBMC or nasal swab RNA-seq data (A) and serum proteins (Olink) (B) that were up-regulated in participants with severe COVID-19 (baseline respiratory severity ordinal scale 5 to 6) compared with mild/moderate COVID-19 (ordinal scale 3 to 4) at visit 1, stratified by age group (youngest or oldest). In (A), n = 165 and 182 patients with PBMC samples in the 18 to 46 and 71 to 96 age groups, respectively; n = 181 and 199 patients with nasal swab samples in the 18 to 46 and 71 to 96 age groups, respectively. In (B), n = 179 and 198 patients in the 18 to 46 and 71 to 96 age groups, respectively. P values in (A) and (B) were calculated with linear modeling and Benjamini-Hochberg correction.
Fig. 7.
Fig. 7.. Integrated analyses of aging in COVID-19 revealed multilayered immune cross-talk in the blood and airway.
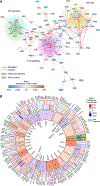
(A) Network analysis was performed on serum cytokines and chemokines and PBMC genes significantly associated with age at visit 1 using protein-protein interactions reported in OmniPath. (B) Analysis of ligand-receptor interactions from cytokine protein data, PBMC RNA-seq data, and nasal RNA-seq data. The innermost ring shows the significant cytokines and chemokines from visit 1 analysis (adjusted P < 0.05) and the magnitude of their average change per 1 year of age. The two outer rings illustrated genes that encode known receptors for each cytokine and their associated change per one year of age. P values for the cytokines were calculated using linear models and Benjamini-Hochberg correction. *P < 0.05, **P < 0.01, and ***P < 0.001.

Update of

References

    1. O’Driscoll M, Ribeiro Dos Santos G, Wang L, Cummings DAT, Azman AS, Paireau J, Fontanet A, Cauchemez S, Salje H, Age-specific mortality and immunity patterns of SARS-CoV-2. Nature 590, 140–145 (2021). - PubMed
    1. Ozonoff A, Schaenman J, Jayavelu ND, Milliren CE, Calfee CS, Cairns CB, Kraft M, Baden LR, Shaw AC, Krammer F, van Bakel H, Esserman DA, Liu S, Sesma AF, Simon V, Hafler DA, Montgomery RR, Kleinstein SH, Levy O, Bime C, Haddad EK, Erle DJ, Pulendran B, Nadeau KC, Davis MM, Hough CL, Messer WB, Higuita NIA, Metcalf JP, Atkinson MA, Brakenridge SC, Corry D, Kheradmand F, Ehrlich LIR, Melamed E, McComsey GA, Sekaly R, Diray-Arce J, Peters B, Augustine AD, Reed EF, Altman MC, Becker PM, Rouphael N; IMPACC study group members, Phenotypes of disease severity in a cohort of hospitalized COVID-19 patients: Results from the IMPACC study. EBioMedicine 83, 104208 (2022). - PMC - PubMed
    1. Wu C, Chen X, Cai Y, Xia J, Zhou X, Xu S, Huang H, Zhang L, Zhou X, Du C, Zhang Y, Song J, Wang S, Chao Y, Yang Z, Xu J, Zhou X, Chen D, Xiong W, Xu L, Zhou F, Jiang J, Bai C, Zheng J, Song Y, Risk factors associated with acute respiratory distress syndrome and death in patients with coronavirus disease 2019 pneumonia in Wuhan, China. JAMA Intern. Med 180, 934–943 (2020). - PMC - PubMed
    1. United States Centers for Disease Control and Prevention, COVID-19 Vaccinations in the United States (United States Centers for Disease Control and Prevention, 2023); https://covid.cdc.gov/covid-data-tracker/#vaccinations_vacc-people-boost...).
    1. United States Centers for Disease Control and Prevention, Risk for COVID-19 Infection, Hospitalization, and Death By Age Group (United States Centers for Disease Control and Prevention, 2022); https://archive.cdc.gov/#/details?url=https://www.cdc.gov/coronavirus/20...).

Publication types