. 2025 Dec 9;86(23):2263-2288.
doi: 10.1016/j.jacc.2025.09.1600.

Prevalence, Awareness, and Treatment of Hypertension in 37 African Countries: Trends From 2003 to 2022

Collaborators, Affiliations

Prevalence, Awareness, and Treatment of Hypertension in 37 African Countries: Trends From 2003 to 2022

Aboubakari Nambiema et al. J Am Coll Cardiol. .

Abstract

Background: Despite the high burden of hypertension in Africa, multicountry and representative studies addressing hypertension-related outcomes are scarce.

Objectives: We estimated the distribution, time trends, and determinants of hypertension status, awareness, treatment, and control in the World Health Organization (WHO) African Region (AFRO) countries.

Methods: We analyzed individual-level data from 61 national, subnational, or community surveys, including WHO STEPwise approach to NCD risk factor Surveillance surveys and Demographic and Health Surveys, conducted between 2003 and 2022 in 37 AFRO countries. Prevalence rates and their 95% CIs were age-standardized and accounted for survey and study-level weights. ORs were estimated using hierarchical logistic regression analysis with random effects for country and survey year.

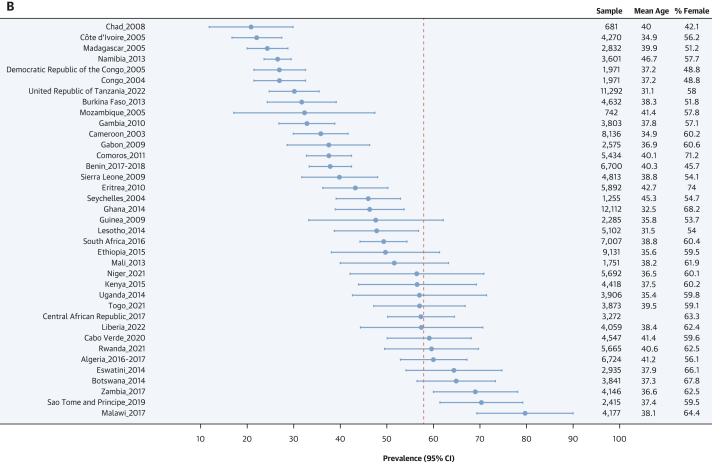
Results: Of the 251,761 participants, 59.5% were female, mean age: 37.1 ± 12.3 in females and 38.6 ± 12.6 in males. Hypertension was diagnosed in 28.9% (95% CI: 27.6%-30.2%) of females and 26.1% (95% CI: 24.5%-27.7%) of males. Among hypertensive individuals, awareness was 62.4% (95% CI: 58.5%-66.3%) for females and 50.5% (95% CI: 44.5%-56.4%) for males; antihypertensive treatment was 15.0% (95% CI: 13.1%-16.9%) in females and 8.4% (95% CI: 6.7%-10.2%) in males; and control rates were 7.3% (95% CI: 5.8%-8.8%) for females and 3.7% (95% CI: 2.4%-4.9%) for males. In multivariable hierarchical analysis, prevalence of hypertension and awareness were associated with older age, higher body mass index, retirement, former smoking (females only), higher education level (with awareness only), and higher alcohol consumption (with awareness in males only). Conversely, lower odds of treatment and control were associated with current smoking and high alcohol consumption. Hypertension-related outcomes were also influenced by contextual (country-level) factors including life expectancy at birth, Gender Development Index, grams of fat per day per capita, Gross Domestic Product per capita, employment in agriculture, and urbanization. Between 2003 and 2022, the overall number of hypertension cases nearly doubled from 241 to 390 million, while treatment and control rates rose from 11.8% to 18.4% and from 7.6% to 9.2%, respectively.

Conclusions: Despite improvement in hypertension awareness, the burden of untreated and uncontrolled hypertension in adults remains substantial in the AFRO with notable sex disparities.

Keywords: WHO African Region; awareness; control; hypertension; pooled cross-sectional studies; treatment.


Conflict of interest statement

Funding Support and Author Disclosures Dr Nambiema is supported by a postdoctoral grant from the Lefoulon-Delalande Foundation. All other authors have reported that they have no relationships relevant to the contents of this paper to disclose.

Figures

None
Graphical abstract
Figure 1
Figure 1
Study Flow Chart DHS = Demographic and Health Surveys; STEPS = World Health Organization's STEPwise approach to NCD risk factor Surveillance; WHO = World Health Organization.
Figure 2
Figure 2
Sex-Stratified Age-Standardized Hypertension Prevalence, Awareness, Treatment, Control Rates, and Mean Blood Pressure Levels Abbreviations as in Figure 1.
Figure 3
Figure 3
Sex-Stratified Maps of Age-Standardized Prevalence, Hypertension, Awareness, and Treatment Rates by Country (A) Sex-stratified maps of age-standardized hypertension prevalence rates by country. (B) Sex-stratified maps of age-standardized hypertension awareness rates by country. (C) Sex-stratified maps of age-standardized hypertension treatment rates by country. (D) Sex-stratified maps of age-standardized hypertension control rates by country. Abbreviations as in Figure 1.
Figure 4
Figure 4
Country-Level Latest Estimates of Hypertension Prevalence, Awareness, Treatment, and Control Rates (A) Country-level latest estimates of hypertension prevalence rates. The plot represents the prevalence of hypertension for a given country across the World Health Organization (WHO) African region. Each dot represents the most recent estimate of hypertension prevalence rate for a given country, with horizontal lines indicating the 95% CI. The dotted vertical line represents the pooled estimate of hypertension prevalence rate and is included to aid visual interpretation. (B) Country-level latest estimates of hypertension awareness rates. The plot represents the prevalence of hypertension awareness among people with hypertension for a given country across the WHO African region. Each dot represents the most recent estimate of hypertension awareness rate for a given country, with horizontal lines indicating the 95% CI. The dotted vertical line represents the pooled estimate of hypertension awareness rate and is included to aid visual interpretation. (C) Country-level latest estimates of hypertension treatment rates. The plot represents the prevalence of hypertension treatment among people with hypertension for a given country across the WHO Africa region. Each dot represents the most recent estimate of hypertension treatment rates for a given country, with horizontal lines indicating the 95% CI. The dotted vertical line represents the pooled estimate of hypertension treatment rate and is included to aid visual interpretation. (D) Country-level latest estimates of hypertension control rates. The plot represents the prevalence of hypertension control among people with hypertension for a given country across the WHO Africa region. Each dot represents the most recent estimate of hypertension control rate for a given country, with horizontal lines indicating the 95% CI. The dotted vertical line represents the pooled estimate of hypertension control rate and is included to aid visual interpretation.
Figure 4
Figure 4
Country-Level Latest Estimates of Hypertension Prevalence, Awareness, Treatment, and Control Rates (A) Country-level latest estimates of hypertension prevalence rates. The plot represents the prevalence of hypertension for a given country across the World Health Organization (WHO) African region. Each dot represents the most recent estimate of hypertension prevalence rate for a given country, with horizontal lines indicating the 95% CI. The dotted vertical line represents the pooled estimate of hypertension prevalence rate and is included to aid visual interpretation. (B) Country-level latest estimates of hypertension awareness rates. The plot represents the prevalence of hypertension awareness among people with hypertension for a given country across the WHO African region. Each dot represents the most recent estimate of hypertension awareness rate for a given country, with horizontal lines indicating the 95% CI. The dotted vertical line represents the pooled estimate of hypertension awareness rate and is included to aid visual interpretation. (C) Country-level latest estimates of hypertension treatment rates. The plot represents the prevalence of hypertension treatment among people with hypertension for a given country across the WHO Africa region. Each dot represents the most recent estimate of hypertension treatment rates for a given country, with horizontal lines indicating the 95% CI. The dotted vertical line represents the pooled estimate of hypertension treatment rate and is included to aid visual interpretation. (D) Country-level latest estimates of hypertension control rates. The plot represents the prevalence of hypertension control among people with hypertension for a given country across the WHO Africa region. Each dot represents the most recent estimate of hypertension control rate for a given country, with horizontal lines indicating the 95% CI. The dotted vertical line represents the pooled estimate of hypertension control rate and is included to aid visual interpretation.
Figure 5
Figure 5
Joint Weighted Proportions of Hypertension Awareness, Treatment, and Control in Each Country This figure presents the latest available survey data for each country (males and females combined). The bars show the joint weighted proportions of “Awareness & Treatment,” “Awareness & Control,” and “Treatment & Control,” respectively. The red dashed line represents the average value of each joint proportion across all the countries.
Figure 6
Figure 6
Sex-Stratified Trend in Age-Standardized Prevalence of Hypertension-Related Outcomes From 2003 to 2022 Trends are based on imputed data for all the 47 countries in the World Health Organization (WHO) African region.
Figure 7
Figure 7
Sex-Stratified Trend in the Absolute Number of Hypertensive Individuals From 2003 to 2022 Trends are based on imputed data for all the 47 countries in the World Health Organization (WHO) African region.
Figure 8
Figure 8
Determinants of Hypertension Status: Sex-Stratified Multivariable Hierarchical Analysis Logistic regression analyses with random effects for country and survey year were conducted to determine individual factors associated with hypertension. The analysis was conducted among all participants. Dots represent adjusted ORs with 95% CIs for each predictor. An OR >1 indicates a positive association (increased odds of hypertension), and an OR <1 indicates a negative association (reduced odds).
Figure 9
Figure 9
Determinants of Hypertension Awareness: Sex-Stratified Multivariable Hierarchical Analysis The analysis was conducted among hypertensive individuals only. Logistic regression analyses with random effects for country and survey year were used. Dots represent adjusted ORs with 95% CIs for each predictor. An OR >1 indicates a positive association (increased odds of hypertension awareness), and an OR <1 indicates a negative association (reduced odds).
Figure 10
Figure 10
Determinants of Hypertension Treatment: Sex-Stratified Multivariable Hierarchical Analysis The analysis was conducted among hypertensive individuals only. Logistic regression analyses with random effects for country and survey year were used. Dots represent adjusted ORs with 95% CIs for each predictor. An OR >1 indicates a positive association (increased odds of hypertension treatment), and an OR <1 indicates a negative association (reduced odds).
Figure 11
Figure 11
Determinants of Hypertension Control: Sex-Stratified Multivariable Hierarchical Analysis The analysis was conducted among hypertensive individuals only. Logistic regression analyses with random effects for country and survey year were used. Dots represent adjusted ORs with 95% CIs for each predictor. An OR >1 indicates a positive association (increased odds of hypertension control), and an OR <1 indicates a negative association (reduced odds).
Figure 12
Figure 12
Determinants of Hypertension Status: Sex-Stratified Multivariable Hierarchical Analysis, Adjusted for Contextual Factors ORs and their 95% CIs were estimated via logistic regression analyses with random effects for country and survey year. The analysis was conducted among all participants. Dots represent adjusted ORs and horizontal lines their 95% CIs for each predictor. An OR >1 indicates a positive association (increased odds of hypertension), and an OR <1 indicates a negative association (reduced odds).
Figure 13
Figure 13
Determinants of Hypertension Awareness: Sex-Stratified Multivariable Hierarchical Analysis, Adjusted for Contextual Factors ORs and their 95% CIs were estimated via logistic regression analyses with random effects for country and survey year. The analysis was conducted among hypertensive individuals only. Dots represent adjusted ORs and horizontal lines their 95% CIs for each predictor. An OR >1 indicates a positive association (increased odds of hypertension awareness), and an OR <1 indicates a negative association (reduced odds).
Figure 14
Figure 14
Determinants of Hypertension Treatment: Sex-Stratified Multivariable Hierarchical Analysis, Adjusted for Contextual Factors ORs and their 95% CIs were estimated via logistic regression analyses with random effects for country and survey year. The analysis was conducted among hypertensive individuals only. Dots represent adjusted ORs and horizontal lines their 95% CIs for each predictor. An OR >1 indicates a positive association (increased odds of hypertension treatment), and an OR <1 indicates a negative association (reduced odds).
Figure 15
Figure 15
Determinants Of Hypertension Control: Sex-Stratified Multivariable Hierarchical Analysis, Adjusted for Contextual Factors ORs and their 95% CIs were estimated via logistic regression analyses with random effects for country and survey year. The analysis was conducted among hypertensive individuals only. Dots represent adjusted ORs and horizontal lines their 95% confidence intervals for each predictor. An OR >1 indicates a positive association (increased odds of hypertension control), and an OR <1 indicates a negative association (reduced odds).

References

    1. Zhou B., Perel P., Mensah G.A., Ezzati M. Global epidemiology, health burden and effective interventions for elevated blood pressure and hypertension. Nat Rev Cardiol. 2021;18(11):785–802. doi: 10.1038/s41569-021-00559-8. - DOI - PMC - PubMed
    1. World Health Organization . World Health Organization; 2023. Global Report on Hypertension: The Race Against a Silent Killer.https://books.google.com/books?hl=en&lr=&id=KaIOEQAAQBAJ&oi=fnd&pg=PR5&d...
    1. World Health Organization Hypertension: key facts [website]. Geneva: March 16, 2023. https://www.who.int/news-room/fact-sheets/detail/hypertension
    1. Our World in Data. Death rate from hypertension, 2021. https://ourworldindata.org/grapher/death-rates-from-high-blood-pressure
    1. Banatvala N., Akselrod S., Bovet P., Mendis S. In: Noncommunicable Diseases. Banatvala N., Bovet P., editors. Routledge; 2023. The WHO global action plan for the prevention and control of NCDs 2013–2030; pp. 234–239.https://www.taylorfrancis.com/chapters/oa-edit/10.4324/9781003306689-36/... - DOI

Substances