. 2016 Jun 17;291(25):12978-90.
doi: 10.1074/jbc.M115.708347. Epub 2016 Apr 26.

Contribution of TyrB26 to the Function and Stability of Insulin: STRUCTURE-ACTIVITY RELATIONSHIPS AT A CONSERVED HORMONE-RECEPTOR INTERFACE

Affiliations

Contribution of TyrB26 to the Function and Stability of Insulin: STRUCTURE-ACTIVITY RELATIONSHIPS AT A CONSERVED HORMONE-RECEPTOR INTERFACE

Vijay Pandyarajan et al. J Biol Chem. .

Abstract

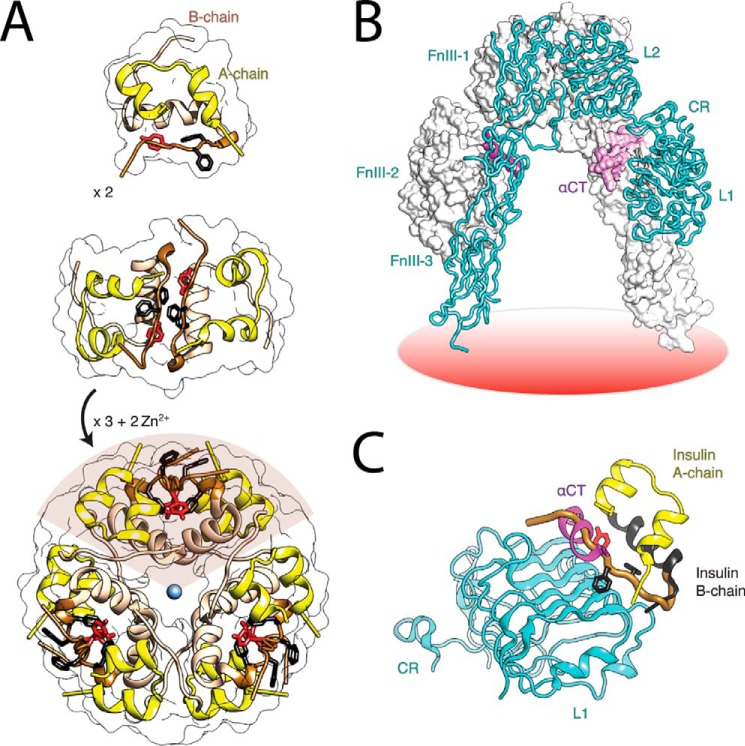
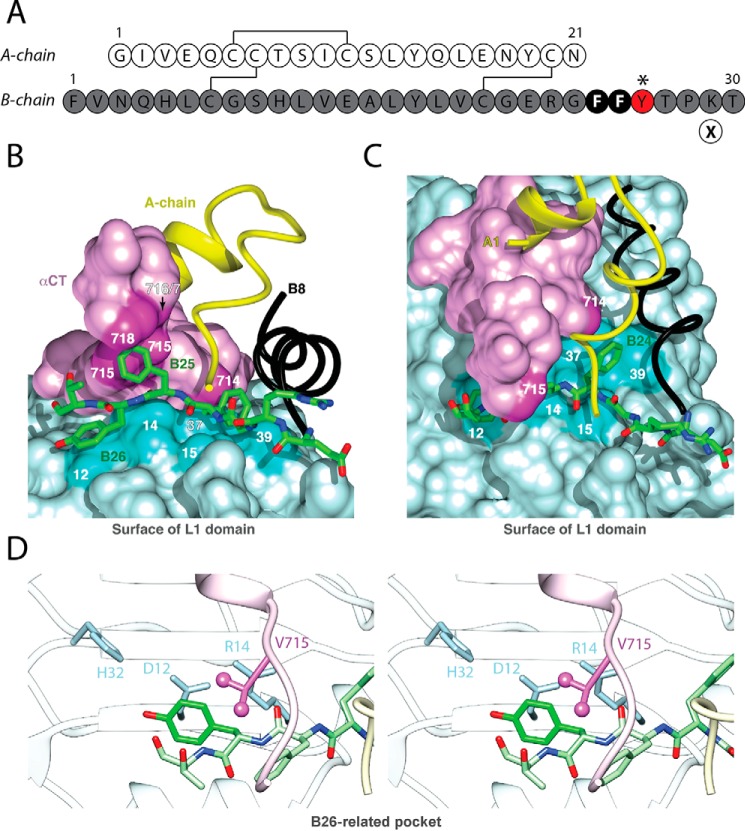
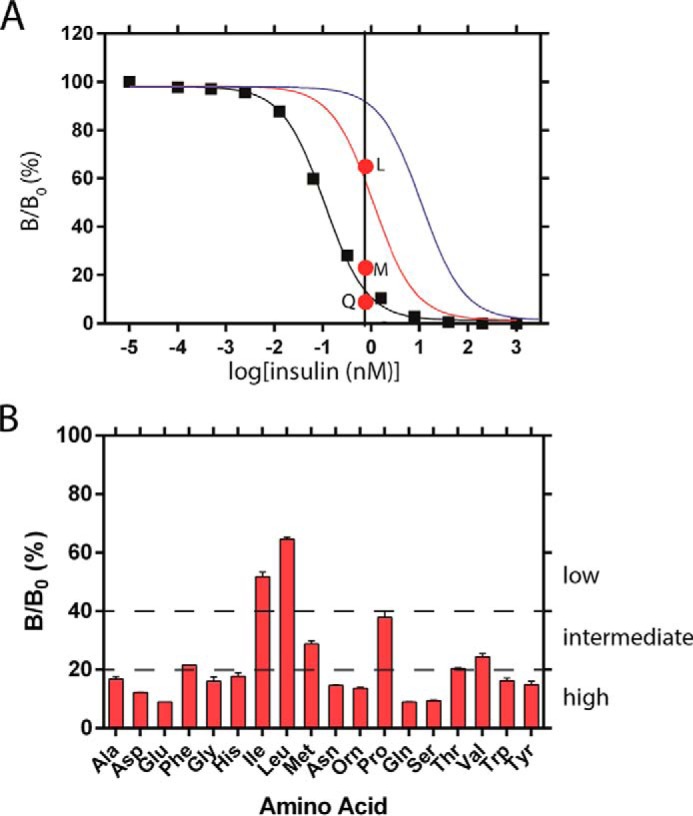
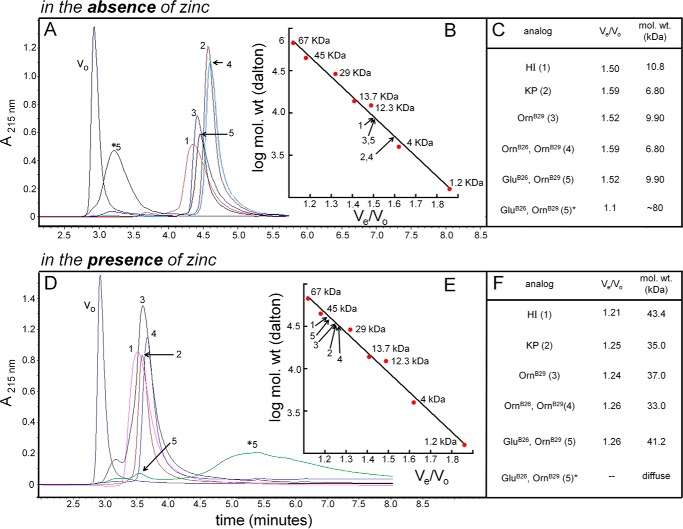
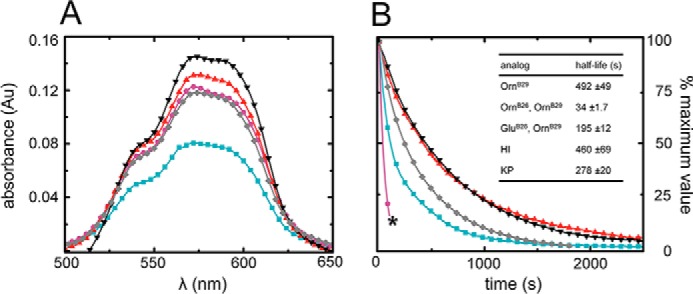
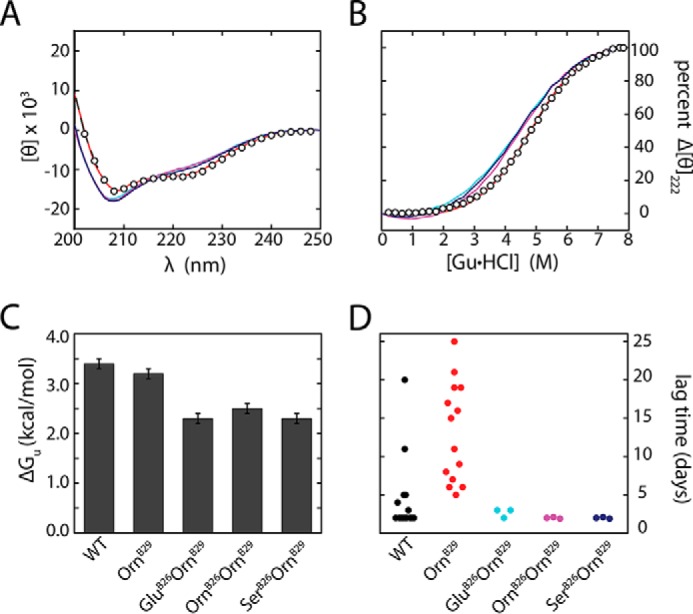
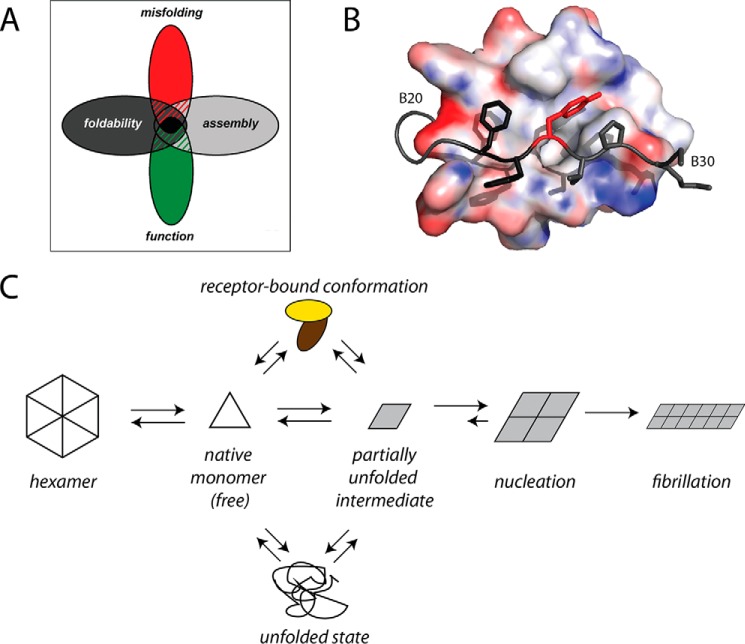
Crystallographic studies of insulin bound to receptor domains have defined the primary hormone-receptor interface. We investigated the role of Tyr(B26), a conserved aromatic residue at this interface. To probe the evolutionary basis for such conservation, we constructed 18 variants at B26. Surprisingly, non-aromatic polar or charged side chains (such as Glu, Ser, or ornithine (Orn)) conferred high activity, whereas the weakest-binding analogs contained Val, Ile, and Leu substitutions. Modeling of variant complexes suggested that the B26 side chains pack within a shallow depression at the solvent-exposed periphery of the interface. This interface would disfavor large aliphatic side chains. The analogs with highest activity exhibited reduced thermodynamic stability and heightened susceptibility to fibrillation. Perturbed self-assembly was also demonstrated in studies of the charged variants (Orn and Glu); indeed, the Glu(B26) analog exhibited aberrant aggregation in either the presence or absence of zinc ions. Thus, although Tyr(B26) is part of insulin's receptor-binding surface, our results suggest that its conservation has been enjoined by the aromatic ring's contributions to native stability and self-assembly. We envisage that such classical structural relationships reflect the implicit threat of toxic misfolding (rather than hormonal function at the receptor level) as a general evolutionary determinant of extant protein sequences.

Keywords: diabetes; hormone; non-standard mutagenesis; protein structure; receptor-tyrosine kinase.


Figures

FIGURE 1.
FIGURE 1.
Structure of insulin and the ectodomain of the IR. A, assembly of the zinc insulin coordinated WT hexamer. The insulin monomer (A and B chains) forms zinc-free dimers via anti-parallel association of B-chain α-helices and C-terminal β-strands (brown); two zinc ions then mediate assembly of three dimers to form a classical hexamer (T6). The A chain is shown in yellow (ribbon representation), and the B chain is in beige (B1-B19) or brown (B20-B30). The conserved aromatic residues of PheB24 and PheB25 are shown as black sticks, whereas TyrB26 is red. B, inverted V-shaped assembly of IR ectodomain homodimer. One monomer is in ribbon representation (labeled), the second is in surface representation. Domains are labeled as follows: L1, first Leu-rich repeat domain; CR, Cys-rich domain; L2, second Leu-rich repeat domain. αCT, α-chain C-terminal segment. C, model of WT insulin in its receptor-free conformation overlaid onto the structure of the insulin-bound μIR (4). L1 and part of CR are shown in powder blue; αCT is shown in purple. Residues PheB24, PheB25, and TyrB26 are as in panel A. The B chain of μIR-bound insulin is shown in black (B6-B19); the brown tube indicates classical location within the overlay of residues B20-B30 of insulin in its receptor-free conformation, highlighting steric clash of B26-B30 with αCT. Coordinates were obtained from PDB entries 4INS, 4ZXB, and 3W11.
FIGURE 2.
FIGURE 2.
Insulin sequence and μIR complex. A, sequence of WT insulin and sites of modification. A and B chains are shown in white and gray, respectively. Conserved aromatic residues PheB24 and PheB25 are highlighted as black circles. The present study focused on substitutions of TyrB26 (red circle); additional substitutions were made at position B29 (Orn; encircled X) to facilitate semi-synthesis. B, stick representation of residues B20-B27 (carbon atoms (green), nitrogen atoms (blue), and oxygen atoms (red) packed between αCT and the L1-β2 strand. B-chain residues B8-B19 are shown as a black ribbon, and the A chain is shown as a yellow ribbon; residues A1-A3 are concealed behind the surface of αCT. Key contact surfaces of αCT with B24-B26 are highlighted in magenta and of L1 with B24-B26 are highlighted in cyan; L1 and αCT surfaces not in interaction with B24-B26 are shown in lighter shades. Insertion of the B20-B27 segment between L1 and αCT is associated with a small rotation of the B20-B23 β-turn and changes in main-chain dihedral angles flanking PheB24 (4). C, orthogonal view to B, showing interaction of the side chain of PheB24 with the nonpolar surface of the L1-β2 sheet. TyrB26 is hidden below the surface of αCT. Engagement of conserved residues A1-A3 against the nonpolar surface of αCT is shown at the top. D, environment of TyrB26 within Site 1 complex (stereo). Neighboring side chains in L1 and αCT are as labeled. Coordinates were obtained from PDB entry 4OGA.
FIGURE 3.
FIGURE 3.
Functional screening of insulin analogs. A, competitive receptor-binding assay of OrnB29-insulin (black squares; the line indicates fitted model); its Kd is estimated to be 0.042 (±0.007) nm. Model curves simulated based on Kd values that are 10-fold (red) or 100-fold (blue) greater than that of OrnB29-insulin are also shown. Red dots indicate binding of insulin analogs LeuB26-OrnB29 (top), MetB26-OrnB29 (middle), and GlnB26-OrnB29 (bottom) at a concentration of 0.75 nm. Vertical axis: B/B0 where B is 125I-TyrA14-insulin bound by receptor at the designated insulin concentration, and B0 is 125I-TyrA14-insulin bound by receptor in the absence of unlabeled insulin. B, coarse screening at analog concentration of 0.75 nm. The analogs were classified as being of low, intermediate, or high affinity depending on the degree of 125I-TyrA14-insulin displacement.
FIGURE 4.
FIGURE 4.
HPLC size-exclusion chromatography and hormone self-assembly. A, retention times of the various analogs (1–5) are shown; identities are described in C. Elution of ∼ 50% of GluB26-OrnB29 as a large multimer of ∼80 kDa is indicated by an asterisk (*5). B, plot of log molecular weight versus Ve/Vo of different molecular mass standard proteins. Ve is the elution volume of each protein, and Vo is the column's void volume. Calibration: apoferritin (443 kDa, Vo), bovine serum albumin (67 kDa) ovalbumin (45 kDa), carbonic anhydrase (29 kDa), ribonuclease A (13.7 kDa), cytochrome C (12.3 kDa), and synthetic peptides (4.0 and 1.2 kDa). The line represents a linear fit, whereas arrows indicate relative elution of analogs 1–5. C, masses of analogs determined from calibrated standards (fitted line, in panel B). D–F, HPLC SEC in the presence of zinc and cyclohexanol. Proteins were fractionated as in A with inclusion of 50 mm cyclohexanol and 0.3 mm ZnCl2; the column was recalibrated in this buffer. With one exception, the OrnB29-insulin analogs, WT human insulin (HI) and KP each eluted as hexamers as indicated in E and F. Although a small fraction of the GluB26-OrnB29-insulin also eluted as a hexamer (5), most of this protein dissociated on the column with a broad elution profile (*5).
FIGURE 5.
FIGURE 5.
Visible absorption spectra of cobalt-stabilized hexamers and kinetics of metal ion release. A, Co2+ d-d bands of OrnB29-insulin (red), GluB26-OrnB29-insulin (turquoise), and OrnB26-OrnB29 -insulin (violet) near 550 nm provide a signature of the R (or Rf) hexameric state. Amplitudes of both OrnB26 and GluB26 variants were attenuated in relation to OrnB29-insulin. Control spectra were provided by WT insulin (black) and KP-insulin (gray). Whereas attenuation of amplitude of the 550-nm band of the OrnB26 variant may be explained by the decreased hexamer formation of the analog, the marked differences in the GluB26 spectrum may be the result of nonspecific aggregates of the analog forming in aqueous solution, as suggested by gel filtration experiments. Au, absorption units. B, sequestration of divalent cobalt ions from insulin analogs by EDTA; OrnB29-insulin (red), GluB26-OrnB29 (turquoise) insulin, and OrnB26-OrnB29 (violet) analogs are shown in relation to those of WT insulin (black) and KP-insulin (gray). OrnB26-OrnB29-insulin formed aggregates that precipitated from solution at intermediate stages of hexamer dissociation (marked by black asterisk): the initial region of the curve was fitted to a monoexponential equation.
FIGURE 6.
FIGURE 6.
Studies of structure, stability, and fibrillation. A, far-UV CD spectra of OrnB29-insulin (red), GluB26-OrnB29-insulin (cyan), OrnB26-OrnB29-insulin (magenta), and SerB26-OrnB29 insulin (dark blue) relative to WT insulin (open circles; black) at neutral pH 7.4 and 25 °C. Ellipticity was normalized per residue. B, corresponding guanidine-unfolding transitions as monitored at 222 nm. Thermodynamic stabilities were derived using a two-state model (see Table 2). Color code is as in A. C, histogram of ΔGu values in kcal mol−1. Marked changes in stability were evident depending on the identity of the substitution. D, dot plot of lag time (days) to fibril formation of insulin analogs. Onset of fibrillation was defined by a 2-fold enhancement of thioflavin T fluorescence; see the section entitled “Functional Substitutions Led To Accelerated Fibrillation” for statistical analysis and p values.
FIGURE 7.
FIGURE 7.
Evolutionary constraints and insulin fibrillation. A, Venn diagram showing intersection of multiple constraints: function, foldability, misfolding, and assembly. We envisage that TyrB26 is conserved due to its explicit roles in folding and assembly and implicit role in avoiding misfolding. B, surface representation of a T-state monomer (PDB entry 4INS) with residues B23–30 (stick model) within a groove between the A and B chains. The aromatic side chains of PheB24 and PheB25 (both dark gray) and TyrB26 (red) are shown. C, general scheme of insulin fibrillation via a partially unfolded monomer intermediate. The native state is protected by classic self-assembly. Disassembly leads to an equilibrium between native and partially folded monomers. The receptor-bound conformation of insulin (top) may also participate in this equilibrium. This partial fold may unfold completely (bottom) as an off-pathway event or aggregate to form a nucleus en route to a proto-filament (right).

References

    1. Dodson G., and Steiner D. (1998) The role of assembly in insulin's biosynthesis. Curr. Opin. Struct. Biol. 8, 189–194 - PubMed
    1. Baker E. N., Blundell T. L., Cutfield J. F., Cutfield S. M., Dodson E. J., Dodson G. G., Hodgkin D. M., Hubbard R. E., Isaacs N. W., and Reynolds C. D. (1988) The structure of 2Zn pig insulin crystals at 1.5 Å resolution. Philos. Trans. R. Soc. Lond. B. Biol. Sci. 319, 369–456 - PubMed
    1. Brange J., Ribel U., Hansen J. F., Dodson G., Hansen M. T., Havelund S., Melberg S. G., Norris F., Norris K., and Snel L. (1988) Monomeric insulins obtained by protein engineering and their medical implications. Nature 333, 679–682 - PubMed
    1. Menting J. G., Yang Y., Chan S. J., Phillips N. B., Smith B. J., Whittaker J., Wickramasinghe N. P., Whittaker L. J., Pandyarajan V., Wan Z. L., Yadav S. P., Carroll J. M., Strokes N., Roberts C. T. Jr., Ismail-Beigi F., Milewski W., Steiner D. F., Chauhan V. S., Ward C. W., Weiss M. A., and Lawrence M. C. (2014) A structural hinge in insulin enables its receptor engagement. Proc. Natl. Acad. Sci. U.S.A. 111, E3395–E3404 - PMC - PubMed
    1. Moller D. E., Yokota A., Caro J. F., and Flier J. S. (1989) Tissue-specific expression of two alternatively spliced insulin receptor mRNAs in man. Mol. Endocrinol. 3, 1263–1269 - PubMed

Publication types