Comparative Study
. 2017 Aug 4;292(31):12981-12993.
doi: 10.1074/jbc.M117.778886. Epub 2017 Jun 19.

The small GTPases K-Ras, N-Ras, and H-Ras have distinct biochemical properties determined by allosteric effects

Affiliations
Comparative Study

The small GTPases K-Ras, N-Ras, and H-Ras have distinct biochemical properties determined by allosteric effects

Christian W Johnson et al. J Biol Chem. .

Abstract

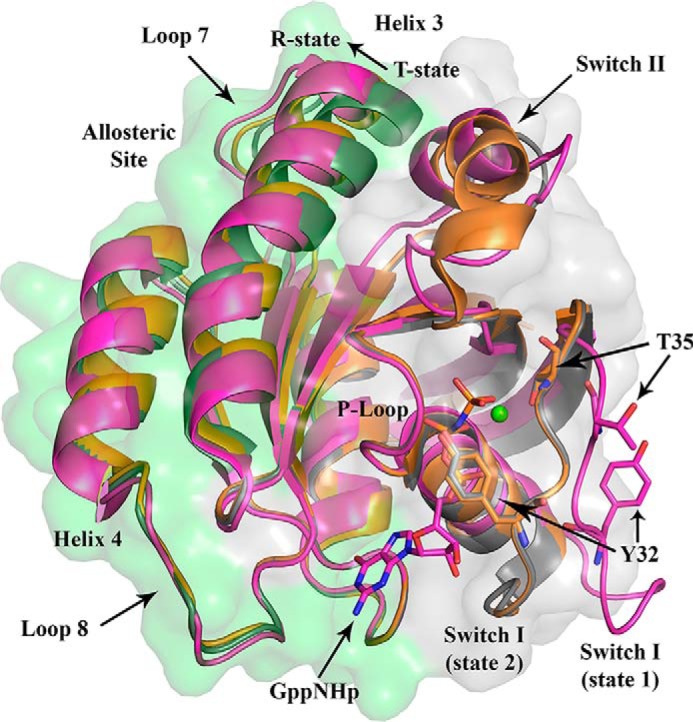
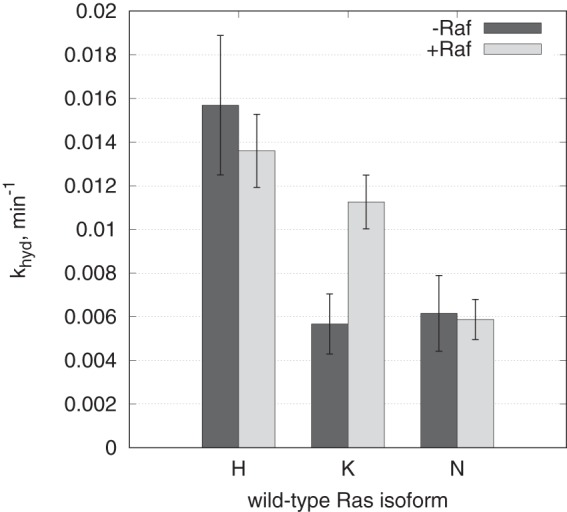
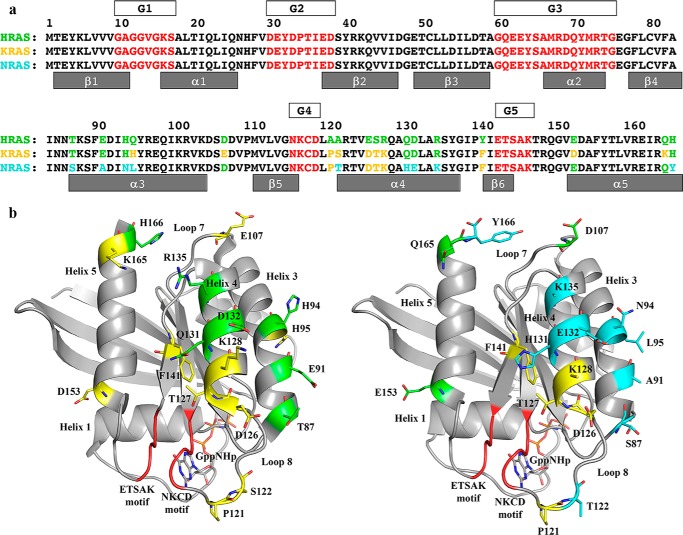
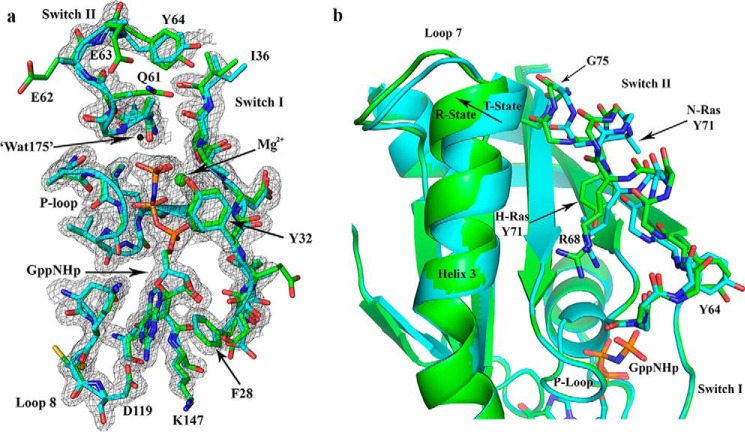
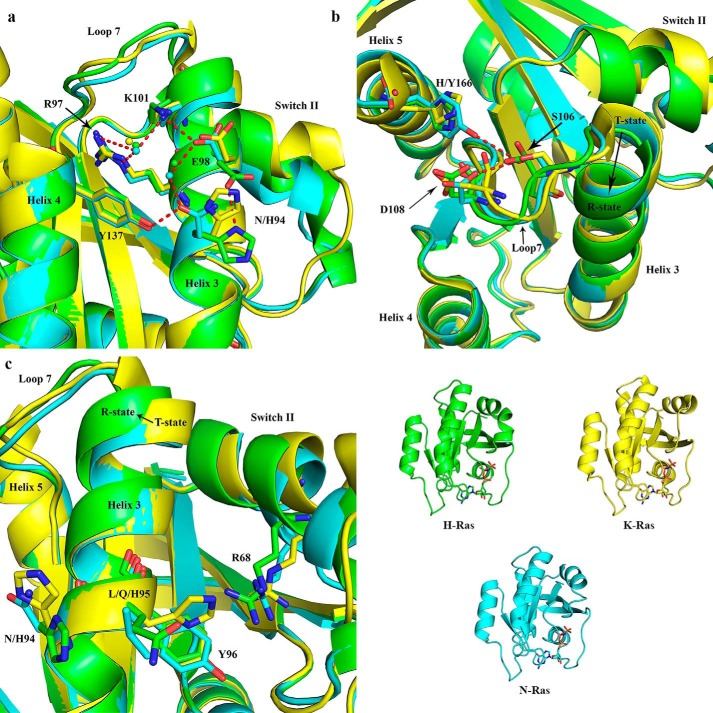
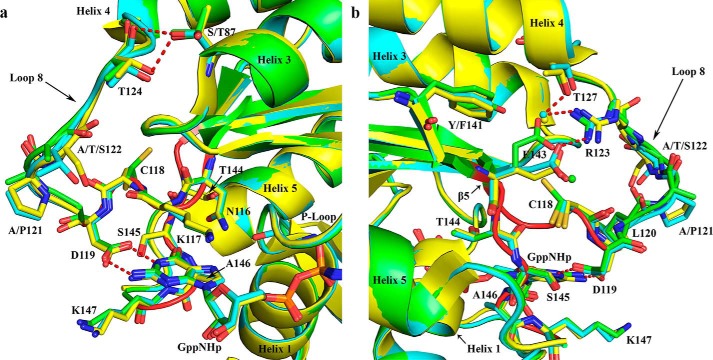
H-Ras, K-Ras, and N-Ras are small GTPases that are important in the control of cell proliferation, differentiation, and survival, and their mutants occur frequently in human cancers. The G-domain, which catalyzes GTP hydrolysis and mediates downstream signaling, is 95% conserved between the Ras isoforms. Because of their very high sequence identity, biochemical studies done on H-Ras have been considered representative of all three Ras proteins. We show here that this is not a valid assumption. Using enzyme kinetic assays under identical conditions, we observed clear differences between the three isoforms in intrinsic catalysis of GTP by Ras in the absence and presence of the Ras-binding domain (RBD) of the c-Raf kinase protein (Raf-RBD). Given their identical active sites, isoform G-domain differences must be allosteric in origin, due to remote isoform-specific residues that affect conformational states. We present the crystal structure of N-Ras bound to a GTP analogue and interpret the kinetic data in terms of structural features specific for H-, K-, and N-Ras.

Keywords: Ras protein; allosteric regulation; conformational change; enzyme catalysis; enzyme structure; oncogene.


Conflict of interest statement

The authors declare that they have no conflicts of interest with the contents of this article

Figures

Figure 1.
Figure 1.
Catalytic G-domain of Ras showing the two lobes and conformational states. Three models are superimposed: H-Ras with switch I in state 1 and the allosteric switch (helix 3/loop 7) in the R state (magenta, PDB code 4EFL); H-Ras with switch I in state 2 and the allosteric switch in the T state (gray, PDB code 2RGE); and H-Ras with switch I in state 2 and the allosteric switch in the R state (orange, PDB code 3K8Y). The effector lobe is shaded in gray, and the allosteric lobe is shaded in green. Tyr-32, which is close to the γ-phosphate of the nucleotide, and Thr-35, which interacts with the Mg2+ ion when switch I is in state 2, are both turned away from the active site in state 1. The conformational change in going from T state to R state is indicated by an arrow. In the T state, helix 3 clashes with switch II, promoting a disordered conformation, whereas in the R state there is room for the switch II helix to form.
Figure 2.
Figure 2.
Single-turnover GTP hydrolysis experiments for H-Ras, K-Ras, and N-Ras conducted in the absence or in the presence of Raf-RBD. The vertical axis represents the single-turnover rate constant khyd: the dark gray and light gray bars correspond to the best-fit values from global fit of combined triplicate experiments in the absence of Raf-RBD and presence of Raf-RBD, respectively. The error bars are calculated as the “low” and “high” limits of nonsymmetrical confidence intervals at 68% confidence level. See supplemental data for the raw data and individual progress curves.
Figure 3.
Figure 3.
Amino acid sequence differences between H-, K-, and N-Ras. a, sequences of the three Ras isoforms are shown, numbered every 10 residues. Amino acid residues common to H-, K-, and N-Ras are in black. Residues that are different in any isoform are shown in green in the H-Ras sequence (top row). Residues in K-Ras that are the same as in H-Ras are shown in green in the K-Ras sequence, and those that are different from H-Ras are shown in yellow (middle row). Residues in N-Ras that are the same as in H-Ras are shown in green, and those that are the same as in K-Ras are shown in yellow, and those that are unique to N-Ras are in cyan (bottom row). The G elements found in all GTPases are shown in red with boxes above the Ras sequences labeled G1–G5. In the effector lobe, G1 is the P-loop; G2 is switch I; and G3 is switch II. In the allosteric lobe, G4 and G5 are the NKXD and EXSAK motifs, respectively, important for binding the guanine base of the nucleotide. b, amino acid differences mapped onto the three-dimensional structure of Ras. Left, K-Ras structure (PDB code 3GFT) with color scheme as shown for the sequence of K-Ras in a. Right, N-Ras structure (PDB code 5UHV, presented here) with color scheme as shown for the sequence of N-Ras in a.
Figure 4.
Figure 4.
Comparison between N-Ras and H-Ras bound to GppNHp, both solved from crystals with symmetry P3221. a, active site shown with 2FoFc electron density map for the N-Ras structure, contoured at the 1σ level. The model for N-Ras (PDB code 5UHV, presented here) is shown in cyan and that for H-Ras (PDB code 1CTQ) is in green. The three phosphorus atoms of GppNHp are shown in orange, and the nitrogen atom that bridges the β- and γ-phosphates is in blue. The nucleotide-binding residues are shown, including the P-loop, switch I, switch II, and NKXD and EXSAK motifs. The magnesium ion is shown as a green sphere, and the nucleophilic water molecule found in the H-Ras structure (Wat-175) is shown as a black sphere. b, T state to R state conformational differences are indicated with an arrow at the C-terminal end of helix 3. Differences are also found in loop 7 and switch II. Disordered side chains were omitted from the model. For example, the N-Ras Tyr-71 side chain is represented up to the Cβ atom. The superposition of N-Ras and H-Ras was based on the nucleotide.
Figure 5.
Figure 5.
Superposition of N-Ras with H-Ras and K-Ras showing areas associated with the allosteric site and switch II. The color scheme in the lower right panel is shown for H-Ras (PDB code 1CTQ, green), K-Ras (PDB code 3GFT, yellow), and N-Ras (PDB code 5UHV, presented here) for clarity. Water molecules are shown in the color of their respective structures. Selected H-bonding interactions are shown as red dashed lines. a, allosteric site with contributing residues from helix 3, loop 7, helix 4, and helix 5 shown as sticks. b, interactions between residue 166 (His in H-Ras and K-Ras and Tyr in N-Ras) and loop 7. c, residue 95 (Gln in H-Ras, His in K-Ras, and Leu in N-Ras) at the kink of helix 3 impacts the allosteric site through residue 94 (His in H-Ras and K-Ras and Asn in N-Ras) and switch II through Tyr-96.
Figure 6.
Figure 6.
Superposition of H-Ras (green), K-Ras (yellow), and N-Ras (cyan) showing areas associated with the nucleotide-binding pocket with an impact on switch I. Water molecules are shown in the color of their respective structures. Selected H-bonding interactions are shown as red dashed lines. The NKXD and EXSAK motifs are highlighted in red, maintaining the ribbon diagram over the associated residues shown as sticks in the color of the particular isoforms. a, residue 87 (Thr in H-Ras and K-Ras and Ser in N-Ras) interaction with Thr-124 in loop 8 and the conserved guanine-binding residues. b, interaction between Arg-123 (loop 8) and Glu-143 (EXSAK motif), showing the effect of residues 141 (Tyr in H-Ras and Phe in K-Ras and N-Ras) on the salt bridge.
Figure 7.
Figure 7.
Single-turnover GTP hydrolysis experiments for H-RasQ95L, H-RasH166Y, and H-RasY141F conducted in the absence of Raf-RBD. The vertical axis represents the single-turnover rate constant khyd, with the bars corresponding to the best-fit value from global fit of combined triplicate experiments in the absence of Raf-RBD. The error bars are calculated as the low and high limits of non-symmetrical confidence intervals at 68% confidence level. See supplemental data for the raw data and individual progress curves.

References

    1. Cox A. D., and Der C. J. (2010) Ras history: the saga continues. Small GTPases 1, 2–27 - PMC - PubMed
    1. Hancock J. F. (2003) Ras proteins: different signals from different locations. Nature reviews. Mol. Cell Biol. 4, 373–384 - PubMed
    1. Prior I. A., and Hancock J. F. (2012) Ras trafficking, localization and compartmentalized signalling. Semin. Cell Dev. Biol. 23, 145–153 - PMC - PubMed
    1. Milburn M. V., Tong L., deVos A. M., Brünger A., Yamaizumi Z., Nishimura S., and Kim S. H. (1990) Molecular switch of signal transduction: structural differences between active and inactive forms of protooncogenic ras proteins. Science 247, 939–945 - PubMed
    1. Buhrman G., O'Connor C., Zerbe B., Kearney B. M., Napoleon R., Kovrigina E. A., Vajda S., Kozakov D., Kovrigin E. L., and Mattos C. (2011) Analysis of binding site hot spots on the surface of Ras GTPase. J. Mol. Biol. 413, 773–789 - PMC - PubMed

Publication types

MeSH terms