. 2016 Jan 29;291(5):2319-30.
doi: 10.1074/jbc.M115.656009. Epub 2015 Dec 1.

Epiregulin Recognition Mechanisms by Anti-epiregulin Antibody 9E5: STRUCTURAL, FUNCTIONAL, AND MOLECULAR DYNAMICS SIMULATION ANALYSES

Affiliations

Epiregulin Recognition Mechanisms by Anti-epiregulin Antibody 9E5: STRUCTURAL, FUNCTIONAL, AND MOLECULAR DYNAMICS SIMULATION ANALYSES

Yuji Kado et al. J Biol Chem. .

Abstract

Epiregulin (EPR) is a ligand of the epidermal growth factor (EGF) family that upon binding to its epidermal growth factor receptor (EGFR) stimulates proliferative signaling, especially in colon cancer cells. Here, we describe the three-dimensional structure of the EPR antibody (the 9E5(Fab) fragment) in the presence and absence of EPR. Among the six complementarity-determining regions (CDRs), CDR1-3 in the light chain and CDR2 in the heavy chain predominantly recognize EPR. In particular, CDR3 in the heavy chain dramatically moves with cis-trans isomerization of Pro(103). A molecular dynamics simulation and mutational analyses revealed that Arg(40) in EPR is a key residue for the specific binding of 9E5 IgG. From isothermal titration calorimetry analysis, the dissociation constant was determined to be 6.5 nm. Surface plasmon resonance analysis revealed that the dissociation rate of 9E5 IgG is extremely slow. The superimposed structure of 9E5(Fab)·EPR on the known complex structure of EGF·EGFR showed that the 9E5(Fab) paratope overlaps with Domains I and III on the EGFR, which reveals that the 9E5(Fab)·EPR complex could not bind to the EGFR. The 9E5 antibody will also be useful in medicine as a neutralizing antibody specific for colon cancer.

Keywords: antibody; cancer; crystal structure; epidermal growth factor (EGF); molecular dynamics; thermodynamics.


Figures

FIGURE 1.
FIGURE 1.
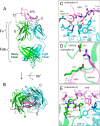
Overall structure of the 9E5(Fab)·hEPR complex. A, front view of the 9E5(Fab)·hEPR complex. hEPR and the heavy and light chains of 9E5(Fab) are colored pink, green, and cyan, respectively. B, top view of the complex structure. The black dotted squares in A and B show the locations of interaction-1 (enlarged in C), interaction-2 (enlarged in D), and interaction-3 (enlarged in E). C, interaction between CDR-L1, CDR-L3, and CDR-H2 in 9E5(Fab) and the N-terminal domain of hEPR (interaction-1). D, interaction between CDR-H1 and CDR-H2 in 9E5(Fab) and the C-terminal region of hEPR (interaction-2). E, interaction between CDR-L2 and CDR-H3 in 9E5(Fab) and the core region of hEPR (interaction-3). In C, D, and E, oxygen, nitrogen, and sulfur atoms are shown in red, blue, and yellow, respectively. Hydrogen bonds and salt bridges are shown as black dashed lines.
FIGURE 2.
FIGURE 2.
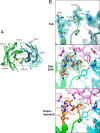
9E5(Fab) fragment superimposed on the 9E5(Fab)·hEPR complex. A, top view of the 9E5(Fab) fragment superimposed on the 9E5(Fab)·hEPR structure. The 9E5(Fab) fragment is shown in the lighter shade. The hEPR molecule in the 9E5(Fab)·hEPR complex is omitted in this figure. Drastic change of CDR-H3 is highlighted in orange. The r.m.s.d. of the Fv domain (residues 2–117 in the heavy chain and residues 2–14 and 17–104 in the light chain) is 0.9 Å. The noticeable interaction (interaction-3) is indicated by the black dashed square. B, close-up view of the superimposed structures of 9E5(Fab) with (solid colors) and without (faint colors) hEPR. 9E5(Fab) (upper panel) and 9E5(Fab)·hEPR (middle panel) show an electron density map around CDR-H3 and CDR-L2. Each 2FoFc electron density map is contoured at 1 σ. In B, the orientation corresponds to Fig. 1E. Bottom panel, 9E5(Fab) fragment superimposed on the 9E5(Fab)·hEPR complex at interaction-3 region.
FIGURE 3.
FIGURE 3.
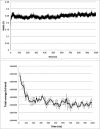
Results from MD simulations of the 9E5(Fab)·hEPR complex. A, r.m.s.d. of the backbone of hEPR and the Fv part of 9E5(Fab) between the simulated structures and the x-ray crystal structure. The r.m.s.d. was averaged for the four simulations. B, block averages of the total energy averaged for the four simulations. The block averages were calculated within each 1.5-ns period. The error bars indicate the standard errors of the block averages of the four total energies.
FIGURE 4.
FIGURE 4.
Calculated short range interaction energies of each hEPR residue with 9E5(Fab). The error bars indicate the standard errors of the mean of the four interaction energies averaged over the respective last 100-ns trajectories.
FIGURE 5.
FIGURE 5.
Titration calorimetry of the interaction between 9E5 IgG and EPR. A–G, typical calorimetric titration of 9E5 IgG (5 μm) with 100–130 μm EPR at 25 °C (top) and integration plot of the data calculated from the raw data (bottom). The solid line corresponds to the best fit curve obtained by least square deconvolution. A, hEPR WT; B, hEPR D9A; C, hEPR S26R; D, hEPR R40A; E, mmEPR WT; F, mmEPR R26S; and G, mmEPR m3.
FIGURE 6.
FIGURE 6.
Multiple sequence alignment of the EPRs. An asterisk (*) indicates fully conserved residues. A colon (:) indicates strongly similar residues. A period (.) indicates weakly similar residues. In mammals, pEPR, rEPR, and mpEPR indicate Pan troglodytes (chimpanzee), Rattus norvegicus (rat), and Mustela putorius furo (European domestic ferret) EPR, respectively. In avian, cEPR indicates Gallus gallus (chicken) EPR. In amphibian, xtEPR indicates Xenopus tropicalis (western clawed frog) EPR. In fish, xmEPR indicates Xiphophorus maculatus (southern platyfish) EPR. The UniProt accession numbers are as follows: hEPR, O14944; pEPR, H2QPP3; mmEPR, Q61521; rEPR, Q9Z0L5; mpEPR, M3YCI3; cEPR, P13387; xtEPR, Q28BU9; and xmEPR, D1MGM2. The alignment and figure drawing were performed using the ClustalΩ and ClustalX programs (39).
FIGURE 7.
FIGURE 7.
Surface plasmon analysis of the interaction between 9E5 IgG and hEPR. Thioredoxin-fused hEPR was immobilized by an amine coupling method on a CM5 sensor chip. The analyses were performed by injecting various concentration of 9E5 IgG (3.1–50 nm) into the sensor chip under the buffer condition of HEPES-buffered saline with surfactant P20 (pH 7.4) at a flow rate of 30 ml min−1 at 25 °C. Black dashed lines show the fitted curves. RU, resonance units.
FIGURE 8.
FIGURE 8.
Superimposed structures of 9E5(Fab)·hEPR and EGF·EGFR complexes. The upper panel shows hEPR in the 9E5(Fab)·hEPR complex (colored) superimposed on EGF in the EGF-EGFR complex (gray; Protein Data Bank code 1IVO). The lower panel shows a close-up view around the binding site of EGFR indicated by the arrow in the upper panel. EGF is wheat-colored. The r.m.s.d. between hEPR and EGF is 0.9 Å. The EGFR residues within 2 Å of the hEPR residues are shown in red. The 9E5(Fab) residues within 2 Å of EGFR are shown in yellow.

References

    1. Nielsen D. L., Kümler I., Palshof J. A., and Andersson M. (2013) Efficacy of HER2-targeted therapy in metastatic breast cancer. Monoclonal antibodies and tyrosine kinase inhibitors. Breast 22, 1–12 - PubMed
    1. Sahin U., Weskamp G., Kelly K., Zhou H. M., Higashiyama S., Peschon J., Hartmann D., Saftig P., and Blobel C. P. (2004) Distinct roles for ADAM10 and ADAM17 in ectodomain shedding of six EGFR ligands. J. Cell Biol. 164, 769–779 - PMC - PubMed
    1. Hynes N. E., and Lane H. A. (2005) ERBB receptors and cancer: the complexity of targeted inhibitors. Nat. Rev. Cancer 5, 341–354 - PubMed
    1. Yarden Y., and Sliwkowski M. X. (2001) Untangling the ErbB signalling network. Nat. Rev. Mol. Cell Biol. 2, 127–137 - PubMed
    1. Fischer O. M., Hart S., Gschwind A., and Ullrich A. (2003) EGFR signal transactivation in cancer cells. Biochem. Soc. Trans. 31, 1203–1208 - PubMed

Publication types

MeSH terms