. 2015 Nov 6;290(45):27280-27296.
doi: 10.1074/jbc.M115.677492. Epub 2015 Sep 14.

Structural Basis for a Unique ATP Synthase Core Complex from Nanoarcheaum equitans

Affiliations

Structural Basis for a Unique ATP Synthase Core Complex from Nanoarcheaum equitans

Soumya Mohanty et al. J Biol Chem. .

Abstract

ATP synthesis is a critical and universal life process carried out by ATP synthases. Whereas eukaryotic and prokaryotic ATP synthases are well characterized, archaeal ATP synthases are relatively poorly understood. The hyperthermophilic archaeal parasite, Nanoarcheaum equitans, lacks several subunits of the ATP synthase and is suspected to be energetically dependent on its host, Ignicoccus hospitalis. This suggests that this ATP synthase might be a rudimentary machine. Here, we report the crystal structures and biophysical studies of the regulatory subunit, NeqB, the apo-NeqAB, and NeqAB in complex with nucleotides, ADP, and adenylyl-imidodiphosphate (non-hydrolysable analog of ATP). NeqB is ∼20 amino acids shorter at its C terminus than its homologs, but this does not impede its binding with NeqA to form the complex. The heterodimeric NeqAB complex assumes a closed, rigid conformation irrespective of nucleotide binding; this differs from its homologs, which require conformational changes for catalytic activity. Thus, although N. equitans possesses an ATP synthase core A3B3 hexameric complex, it might not function as a bona fide ATP synthase.

Keywords: ATP synthase; Nanoarchaeum equitans; archaea; catalytic core; crystal structure; evolution; protein complex.


Figures

FIGURE 1.
FIGURE 1.
Schematic representation of the putative N. equitans ATP synthase. The N. equitans ATP synthase is made up of five subunits as follows: A, B, D, I, and c (proteolipid). The putative N. equitans ATP synthase model was generated based on the model of A1A0-ATP synthase of M. jannaschii.
FIGURE 2.
FIGURE 2.
Conserved sequences and the phylogenetic analysis. a shows the sequence alignment of the Walker A and Walker B regions of NeqA and NeqB with homologs. The functionally important and conserved Glu-256 of NeqA is marked with an asterisk. NeqB was compared with the F-type ATP synthase subunit β and the homologous Walker regions, as highlighted. b and c, phylogenetic tree shows the evolutionary distance between NeqA and NeqB and their homologs. The numbers in red indicate the confidence levels obtained from bootstrapping for that particular node.
FIGURE 3.
FIGURE 3.
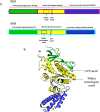
Structure of N. equitans subunits. a, bar diagram representing conserved motifs on the NeqA and NeqB subunits. b, crystal structure of NeqB (in corresponding colors). The Walker homologous and GVP motif are labeled.
FIGURE 4.
FIGURE 4.
Interactions of NeqA and NeqB with nucleotides. Representative ITC profiles for binding of NeqA and NeqB are shown. The upper part of each panel shows the thermogram after baseline correction, and the lower part show the fit of the data to a model, taking into consideration a single class of binding sites. a, ITC profiles representing moderate affinity binding between Mg-ATP (300 μm) and NeqA (10 μm). The c value is 1.9. b, low affinity binding between Mg-ATP (1 mm) and NeqB (10 μm). The c value is 0.16. The table represents the derived thermodynamic parameters.
FIGURE 5.
FIGURE 5.
Interaction of NeqA and NeqB to form hexameric complex. a, AUC profile representing the formation of the catalytic core (A3B3) hexamer (∼300 kDa). b, NeqAB complex was compared with monomeric NeqA and NeqB using blue native gels to show formation of an ∼300-kDa hexamer in the NeqAB complex. c, gel filtration profile of 15 mg/ml purified NeqAB complex overlaid with standard calibration proteins from GE Healthcare; ferritin, 440 kDa; conalbumin, 75 kDa. The red peak at 11.75 ml represents the AB complex at ∼300 kDa.
FIGURE 6.
FIGURE 6.
Interactions between NeqA and NeqB. a, calorimetric titrations corresponding to the interaction between NeqA and NeqB in the absence of nucleotide (left, 100 μm NeqA titrated into 10 μm NeqB). The c value is 0.90. b, in the presence (right, 100 μm NeqB titrated into 10 μm NeqA) of nucleotide, Mg-ADP. The c value is 89. An increase in binding affinity between NeqA and NeqB is observed in the presence of Mg-ADP. The table represents the derived thermodynamic parameters.
FIGURE 7.
FIGURE 7.
Structure of NeqAB. a, structure of apo-NeqAB showing NeqA (magenta) and NeqB (cyan) in cartoon representation. The three major domains have been labeled. The P-loop is indicated in black. b, Cα trace of superimposition of NeqB (cyan) from the apo-NeqAB complex and independent NeqB (blue) shows the conformational differences in the N-terminal regions.
FIGURE 8.
FIGURE 8.
Cα trace representation of the bulge region on NeqA. NeqA (magenta) overlaid with a. F-type β (yellow), and b, V-type A subunit (green) shows the Bulge region that is typical of the V/A-type ATPase A subunits.
FIGURE 9.
FIGURE 9.
Structure of NeqAB complex and its closed conformation. Structure of NeqAB complex and its closed conformation. The apo-NeqAB complex (NeqA in magenta and NeqB in cyan) overlaid with (left) nucleotide-free (open) and (right) nucleotide-bound (closed) T. thermophilus V1 complex AB dimers (A in green; B in gold color). This figure shows that the apo-NeqAB is similar to nucleotide-bound AB dimers of T. thermophilus. The black arrows indicate the displacement between the C-terminal helices of subunits A and B of T. thermophilus. Only the C-terminal regions of the structures are shown. The helix numbers are labeled.
FIGURE 10.
FIGURE 10.
Superimposition of Cα trace representation of independent NeqB with homologs. a, subunit B from T. thermophilus V1 complex (PDB code 3GQB) (green) versus NeqB (marine blue). b, independent M. mazei subunit B (PDB code 2C61) (dark red) versus NeqB (marine blue). This comparison shows the conformational change taking place in the N terminus in response to the binding of subunit A.
FIGURE 11.
FIGURE 11.
Interaction of nucleotides with NeqA and NeqB. Stereo diagrams are as follows: a, side chains of NeqA (magenta) and NeqB (cyan) interacting with Mg-ADP (green); b, side chains of NeqA and NeqB interacting with Mg-AMP-PNP (blue). In both images, the P-loop motif (Walker A) residues of NeqA in its interaction with the ligand are shown in a cartoon loop representation, and the Arg-326 residue from NeqB is highlighted in red. The final electron density map (2FoFc map, contoured at 1.0σ) is shown for both ADP and AMP-PNP. c, nucleotide binding pocket of NeqA is shown in electrostatic surface representation, with AMP-PNP in stick representation (green). The inset shows the orientation of AMP-PNP on the surface of NeqA. For clarity, NeqB is not shown.
FIGURE 12.
FIGURE 12.
Comparison of apo-NeqAB with its nucleotide-bound forms. Superimposition of NeqAB_apo with a. NeqAB_ADP and b with NeqAB_AMP-PNP.
FIGURE 13.
FIGURE 13.
Hexameric catalytic core complex A3B3 hexamer. a, ribbon representation displaying the top-down view of the central cavity of AMP-PNP-bound A3B3 hexameric core of the V1-ATPase from E. hirae (PDB code 3VR3). AE and BE denote the open or empty forms, whereas AT/T′ and BT/T′ denote the tight or closed form. The open and close dimers have also been indicated. b, NeqAB catalytic core complex (A3B3) was generated using symmetry-related molecules displaying a top-down view of the central cavity of AMP-PNP-bound NeqAB hexameric core complex (A3B3).
FIGURE 14.
FIGURE 14.
Schematic model of the inactive mechanism of the N. equitans core complex system. The nucleotide-induced conformational changes as seen in the asymmetric states of the active T. thermophilus A3B3 complex (PDB code 3W3A) are represented in the left panel (ADP in blue solid circles), and the right panel shows the lack of conformational changes in NeqAB dimer in the presence of nucleotide, AMP-PNP (black-yellow circle) and ADP.

References

    1. Boyer P. D. (1997) The ATP synthase–a splendid molecular machine. Annu. Rev. Biochem. 66, 717–749 - PubMed
    1. Cross R. L., and Müller V. (2004) The evolution of A-, F-, and V-type ATP synthases and ATPases: reversals in function and changes in the H+/ATP coupling ratio. FEBS Lett. 576, 1–4 - PubMed
    1. Fillingame R. H. (1997) Coupling H+ transport and ATP synthesis in F1F0-ATP synthases: glimpses of interacting parts in a dynamic molecular machine. J. Exp. Biol. 200, 217–224 - PubMed
    1. Mitchell P. (1966) Chemiosmotic coupling in oxidative and photosynthetic phosphorylation. Biol. Rev. Camb. Philos. Soc. 41, 445–502 - PubMed
    1. Walker J. E., Fearnley I. M., Gay N. J., Gibson B. W., Northrop F. D., Powell S. J., Runswick M. J., Saraste M., and Tybulewicz V. L. (1985) Primary structure and subunit stoichiometry of F1-ATPase from bovine mitochondria. J. Mol. Biol. 184, 677–701 - PubMed

Publication types

MeSH terms

LinkOut - more resources