

Hydration water and bulk water in proteins have distinct properties in radial distributions calculated from 105 atomic resolution crystal structures
- PMID: 18754631
- PMCID: PMC2768875
- DOI: 10.1021/jp802795a
Hydration water and bulk water in proteins have distinct properties in radial distributions calculated from 105 atomic resolution crystal structures
Abstract
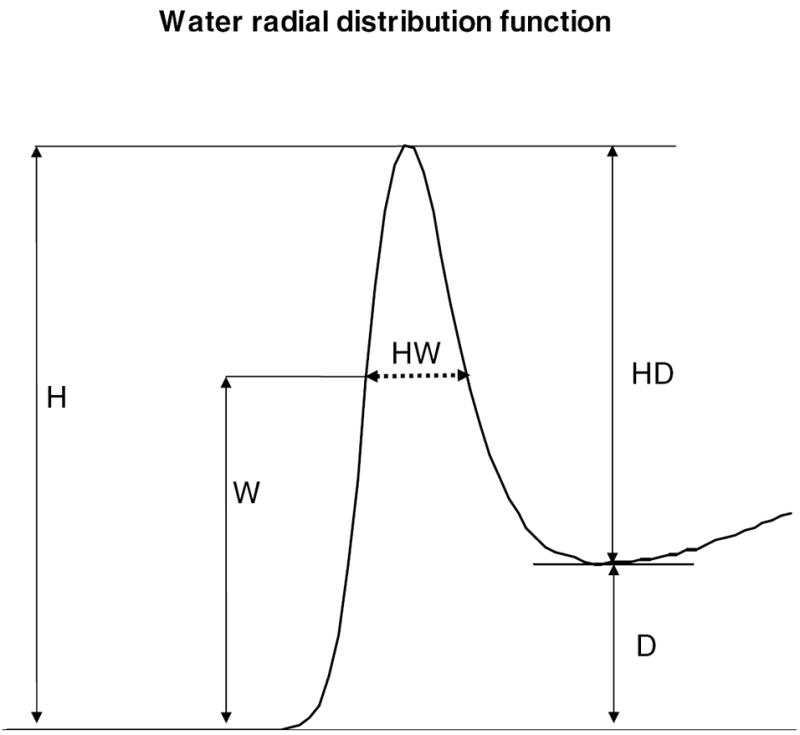
Water plays a critical role in the structure and function of proteins, although the experimental properties of water around protein structures are not well understood. The water can be classified by the separation from the protein surface into bulk water and hydration water. Hydration water interacts closely with the protein and contributes to protein folding, stability, and dynamics, as well as interacting with the bulk water. Water potential functions are often parametrized to fit bulk water properties because of the limited experimental data for hydration water. Therefore, the structural and energetic properties of the hydration water were assessed for 105 atomic resolution (<or=1.0 A) protein crystal structures with a high level of hydration water by calculating the experimental water-protein radial distribution function or surface distribution function (SDF) and water radial distribution function (RDF). Two maxima are observed in SDF: the first maximum at a radius of 2.75 A reflects first shell and hydrogen bond interactions between protein and water, and the second maximum at 3.65 A reflects second shell and van der Waals interactions between water and nonpolar atoms of protein-forming clathrate-hydrate-like structures. Thus, the two shells do not overlap. The RDF showed the features of liquid water rather than solid ice. The first and second maxima of RDF at 2.75 and 4.5 A, respectively, are the same as for bulk water, but the peaks are sharper, indicating hydration water is more stable than bulk water. Both distribution functions are inversely correlated with the distribution of B factors (atomic thermal factors) for the waters, suggesting that the maxima reflect stable positions. Therefore, the average water structure near the protein surface has experimentally observable differences from bulk water. This analysis will help improve the accuracy for models of water on the protein surface by providing rigorous data for the effects of the apparent chemical potential of the water near a protein surface.
Figures


References
-
- Purkiss A. The protein-solvent interface: a big splash. Philosophical Transactions of the Royal Society A: Mathematical, Physical and Engineering Sciences. 2001;359(1785):1515–1527.
-
- Roberts BC, Mancera RL. Ligand-Protein Docking with Water Molecules. J Chem Inf Model. 2008 - PubMed
-
- Nakasako M. Large-scale networks of hydration water molecules around bovine beta-trypsin revealed by cryogenic X-ray crystal structure analysis. J Mol Biol. 1999;289(3):547–64. - PubMed
-
- Higo J, Nakasako M. Hydration structure of human lysozyme investigated by molecular dynamics simulation and cryogenic X-ray crystal structure analyses: on the correlation between crystal water sites, solvent density, and solvent dipole. J Comput Chem. 2002;23(14):1323–36. - PubMed
-
- Rashin AA, Iofin M, Honig B. Internal cavities and buried waters in globular proteins. Biochemistry. 1986;25(12):3619–25. - PubMed
Publication types
MeSH terms
Substances
Associated data
- Actions
- Actions
- Actions
- Actions
- Actions
- Actions
- Actions
- Actions
- Actions
- Actions
- Actions
- Actions
- Actions
- Actions
- Actions
- Actions
- Actions
- Actions
- Actions
- Actions
- Actions
- Actions
- Actions
- Actions
- Actions
- Actions
- Actions
- Actions
- Actions
- Actions
- Actions
- Actions
- Actions
- Actions
- Actions
- Actions
- Actions
- Actions
- Actions
- Actions
- Actions
- Actions
- Actions
- Actions
- Actions
- Actions
- Actions
- Actions
- Actions
- Actions
- Actions
- Actions
- Actions
- Actions
- Actions
- Actions
- Actions
- Actions
- Actions
- Actions
- Actions
- Actions
- Actions
- Actions
- Actions
- Actions
- Actions
- Actions
- Actions
- Actions
- Actions
- Actions
- Actions
- Actions
- Actions
- Actions
- Actions
- Actions
- Actions
- Actions
- Actions
- Actions
- Actions
- Actions
- Actions
- Actions
- Actions
- Actions
- Actions
- Actions
- Actions
- Actions
- Actions
- Actions
- Actions
- Actions
- Actions
- Actions
- Actions
- Actions
- Actions
- Actions
- Actions
- Actions
- Actions
Grants and funding
LinkOut - more resources
Full Text Sources
