

Evolutionary adaptation of the protein folding pathway for secretability
- PMID: 36031863
- PMCID: PMC9713715
- DOI: 10.15252/embj.2022111344
Evolutionary adaptation of the protein folding pathway for secretability
Abstract
Secretory preproteins of the Sec pathway are targeted post-translationally and cross cellular membranes through translocases. During cytoplasmic transit, mature domains remain non-folded for translocase recognition/translocation. After translocation and signal peptide cleavage, mature domains fold to native states in the bacterial periplasm or traffic further. We sought the structural basis for delayed mature domain folding and how signal peptides regulate it. We compared how evolution diversified a periplasmic peptidyl-prolyl isomerase PpiA mature domain from its structural cytoplasmic PpiB twin. Global and local hydrogen-deuterium exchange mass spectrometry showed that PpiA is a slower folder. We defined at near-residue resolution hierarchical folding initiated by similar foldons in the twins, at different order and rates. PpiA folding is delayed by less hydrophobic native contacts, frustrated residues and a β-turn in the earliest foldon and by signal peptide-mediated disruption of foldon hierarchy. When selected PpiA residues and/or its signal peptide were grafted onto PpiB, they converted it into a slow folder with enhanced in vivo secretion. These structural adaptations in a secretory protein facilitate trafficking.
Keywords: HDX-MS; folding; mature domain; secretion; signal peptide.
© 2022 The Authors.
Figures
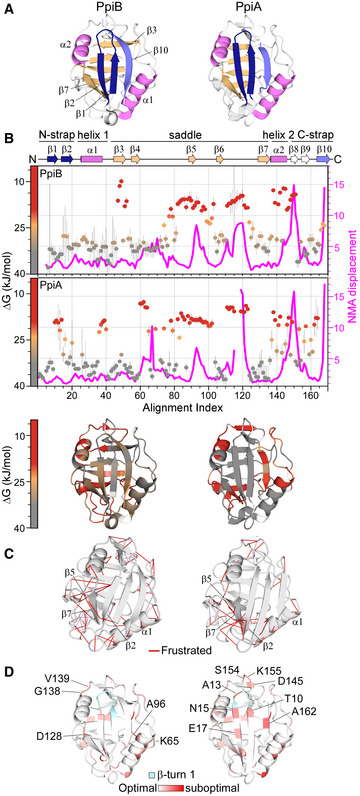
Structural features are colour‐indicated on 3D structures (top) or linear map of secondary structure (bottom; from Appendix Fig S1D). β‐strands that connect the sheets to form the straps and quasi β‐barrel and α‐helices as annotated.
Dynamics of native PpiA/B. Top left y‐axis (reversed) displayed as ΔG/residue (from PyHDX analysis of HDX‐MS data at 30°C) colour‐indicated across the linear sequence (top; x‐axis) or on 3D structures (bottom). The apparent rigidity at the extreme N‐tail of PpiA was attributed to high back exchange of this peptide and, therefore, ignored. Dots: grey (stable); orange (flexible); red (unstructured). Grey error bars: variation between subsequent residues (see Fig EV1E for %D‐uptake values; HDX‐MS data in Dataset EV4). n = 3 technical repeats. Top, right y‐axis: normal mode analysis; total displacement of normal modes 7–13 (unweighted sum; magenta) (see Materials and Methods).
Direct frustrated interactions (red lines) and water‐mediated ones (purple, dashed) are indicated on 3D structures.
Suboptimal residue/structure compatibility determined by Rosetta scoring analysis coloured using a gradient (see Materials and Methods) on the 3D structures.
- A
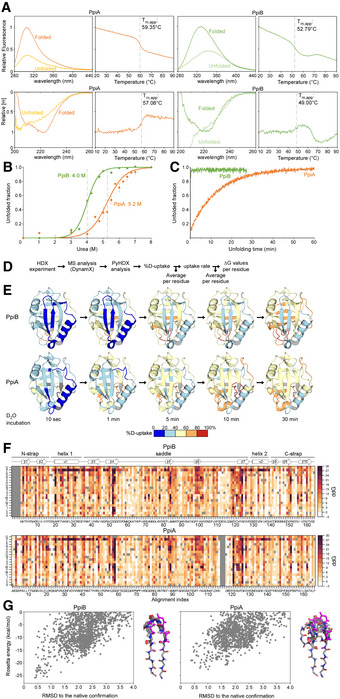
Raw data of thermal denaturation analysis monitored by intrinsic fluorescence (top, in relative units setting the highest value at 1 with excitation at 260 nm and emission at 327 for PpiA and PpiB based on the mainly buried tyrosine residues, as PpiA does not contain Trp and PpiB only contains an outward facing one and circular dichroism (bottom, CD; in relative molar ellipticity ([θ]) with highest value at 1) at 222 nm. The full spectrum of the folded (protein at 25°C) and unfolded state (protein at T m,app + 5°C) is displayed on the left, and apparent melting temperature (T m,app) on the right was determined after smoothening the curves with a Butterworth filter (see Materials and Methods) and plotting the first derivative where the maximum (CD) or minimum (Intrinsic Fluorescence) was determined using a Python script (see Materials and Methods). The T m,app is indicated on the graph with a dotted grey line. n = 3 technical repeats.
- B
Chaotrope denaturation analysis in urea monitored by CD at 222 nm (depicted as unfolded fraction calculated from [θ] of the unfolded protein (8 M Urea) set as 1 and that of the natively purified protein (0 M Urea) set as 0). The raw data are shown with dots and fitted using a two‐state transition model ((Lowe et al, 2018), see Materials and Methods) to determine the transition midpoint. n = 3 technical repeats, s.d.
- C
Unfolding of PpiB (green) and PpiA (orange) from their native states in 8 M Urea monitored with CD at 22°C at 222 nm (depicted as the unfolded fraction (as in B.)).
- D
Steps performed in PyHDX software to calculate the ΔG values per residue as derived from the local HDX‐MS analysis of the structural dynamics of the native states (see detailed analysis in (Smit et al, 2021), Fig 1B).
- E
Structural dynamics of the native state of PpiB and PpiA derived from local HDX‐MS analysis (Fig 1B). The weighted average %D‐uptake at the indicated HDX time was mapped on the 3D structures (PpiB PDB 1LOP, PpiA PDB 1V9T). 0–20%, 20–40%, 40–60%, 60–80% and 80–100% Deuterium uptake intervals are shown in the indicated colour scale. Residues without coverage are in grey. n = 3 technical repeats.
- F
Mutational free energy (ddG) predictions for PpiB (PDB 1LOP and PpiA (PDB 1V9T) using in silico mutagenesis displayed as a custom colour map with all substitutions indicated (see scripts on GitHub). Missing residues from alignment and native residues are in dark grey. Increase in ddG values (brown colour) signifies mutations that destabilize the structure or a more stable native residue, while decrease in ddG values (white) signifies the possibility of other residues to fit that same position.
- G
Computed conformation/energy landscape of β‐hairpin 1 of PpiB (left, PDB 1LOP) and PpiA (right, PDB 1V9T). Each point represents one decoy generated with the Rosetta KIC protocol, scored based on Rosetta total_score and aligned to the native structure. The structure of the 10 lowest energy decoys for each protein is presented on the right side of each graph.
- A
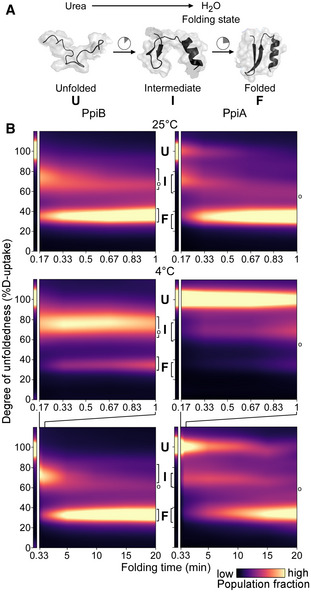
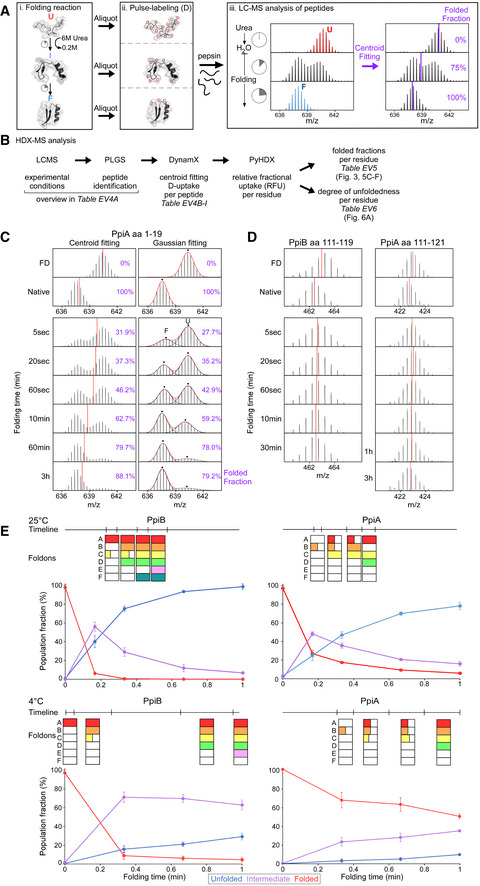
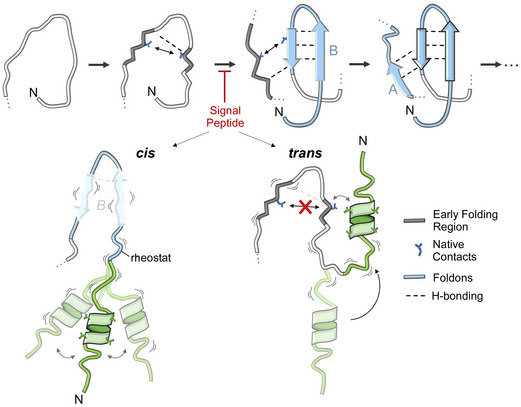
Cartoon representation of in vitro refolding protein over time, upon dilution from chaotrope into aqueous buffer.
- B
Folding kinetics of PpiB (left) and PpiA (right), at 25°C (1 min, top) or 4°C (1 and 20 min, bottom). Folding populations are displayed as a continuous colour map of their %D‐uptake (y‐axis) across time (x‐axis). For m/z spectra, see Fig EV2B and C; Dataset EV3. n = 2–6 (biological repeats). Left thin panels: unfolded state (U; 6 M urea); Right main panels: refolding data (0.2 M urea); I, Intermediate; F, Folded populations; o, modifications/adducts, not part of the folding pathway.
- A
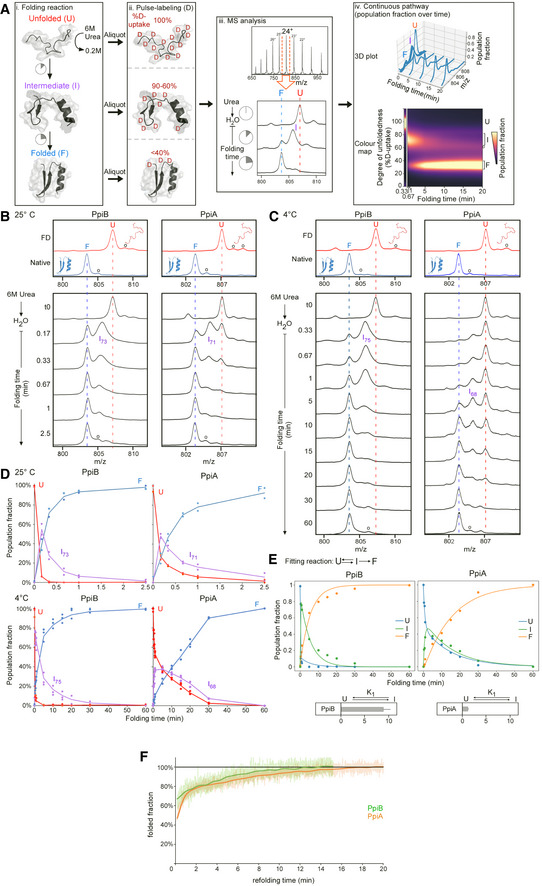
Pipeline of processing in vitro refolding kinetics of intact proteins using global HDX‐MS analysis and subsequent visualization as a colour map (Fig 2B). (i) Denatured proteins are refolded out of chaotrope (6 M urea) into aqueous buffer where the different folding states are observed. (ii) An aliquot of the refolding reaction is removed at different timepoints and pulse‐labelled in high % D2O where the amount of Deuterium taken up reflects the number of non‐H‐bonded/solvent‐accessible backbone amides and is inversely related to how folded (i.e. stably H‐bonded) the protein is. The unfolded state (6 M Urea) is experimentally defined as a single peak/population with maximum D‐uptake (set as 100%), followed by intermediate D‐uptake and finally the lowest D‐uptake for the folded state. (iii) From the electrospray ionisation MS analysis of each refolding timepoint, an m/z spectrum with multiple charged m/z peaks is obtained. From the latter, a single high‐intensity peak (highest Signal over Noise) is selected and smoothed (Savitzky‐Golay, window: 15, number: 5) to be followed over different refolding timepoints (as depicted in the bottom section). Due to Deuterium being 1 Da heavier than Hydrogen, a shift from a high to lower m/z is observed over time as the protein folds and takes up fewer Deuterium during pulse‐labelling. “o”: Potassium adducts and Urea modification peaks that are visible on the (un)folded state. (iv) The intensities of the folding populations from the single m/z peak at different timepoints are normalized to the integrated area (See Materials and Methods). To observe the conversion of the folding populations over time, a 3D plot was displayed with all the normalized m/z spectra over time. The normalized intensities now reflect the population fractions of each folding state. Linear interpolation was performed between the m/z spectra over time to get a continuous time course of the refolding pathway and used to create a 2D colour map to visualize the interconversion between folding states indicated based on their degree of unfoldedness (%D‐uptake). The colour gradient (“magma” colourmap) reflects increasing population fractions ranging from small (dark) to high (yellow; see Materials and Methods, Dataset EV3C).
- B, C
Smoothed spectra of the 24+ charged m/z peak (highest intensity) of the refolding kinetics of PpiA and PpiB from global HDX‐MS analysis at the indicated timepoints (4 and 25°C) that were used for constructing the continuous colour map (Fig 2B). The denatured protein or the fully deuterated (FD; 6 M Urea‐d4 for 1 h; red line) control and the Native control (i.e. soluble purified native protein; blue line) are marked throughout the folding timepoints. “o” refers to Potassium adducts and Urea modification peaks that are also visible in the colour maps in Fig 2B.
- D
Population fraction over time after Lorentzian curve fitting of the 24+ charged m/z peak in (B and C) with the unfolded (red), intermediate (purple) and folded (blue) state (from biological repeats, see below). The relative percentage of D‐uptake of each intermediate state is noted in its subscript. For PpiB at 25°C (n = 2), PpiA at 25°C (n = 2), PpiB at 4°C (n = 7) and PpiA (n = 4), data are shown as dots (up to 3 repeats) and average as line.
- E
For 4°C, the population fractions were fitted with an ODE model (see equation, see Materials and Methods). The fitted curves are displayed with the different folding states (Unfolded (U), Intermediate (I) and Folded (F)) and the equilibrium constant K1 is displayed below. n = 4 biological repeats.
- F
Refolding of PpiA (orange) and PpiB (green) monitored by CD at 4°C (recorded at 222 nm and shown as the folded fraction over time setting the 6 M Urea state as 0 and the final 0.2 M Urea state as 1).
- A
Pipeline of processing in vitro refolding kinetics of pepsinized proteins using local HDX‐MS analysis (Fig 2B). (i) Denatured proteins are refolded out of chaotrope (6 M urea) into aqueous buffer where the different folding states are observed. (ii) An aliquot of the refolding reaction is removed at different timepoints and pulse‐labelled in high %D2O where the amount of Deuterium taken up reflects the number of non‐H‐bonded/solvent‐accessible backbone amides and is inversely related to how folded (i.e. stably H‐bonded) the protein is. Pulse‐labelled proteins are pepsinized to determine the D‐uptake of each peptide to obtain folding details. (iii) All peptides are identified by their retention time during Liquid Chromatography and their m/z spectrum (Englander et al, ; Tsirigotaki et al, 2017b). The unfolded and folded state are a single distribution with the highest and lowest D‐uptake, respectively, where during folding the conversion from a completely unfolded to the folded state is observed (bimodal distributions, EX1 HDX kinetics (Englander et al, ; Tsirigotaki et al, 2017b)). The average D‐uptake of each distribution is determined using a centroid that gets converted to the folded fraction using the D‐uptake of the unfolded state as 0% folded and that of the folded state as 100%.
- B
The schematic pipeline describes the steps of analysis we performed on the local HDX‐MS data using PyHDX, in order to obtain folded fractions per residue or degree of unfoldedness per residue. Data from different steps are presented on separate Datasets (as indicated) and were used on the indicated Figures.
- C
Comparison in data processing of a PpiA peptide to calculate folded fractions (results in Dataset EV5 per residue) using centroids vs. Gaussian fitting. Peptide aa1‐19 demonstrates folding with bimodal distributions. Left, the centroid position (red line) of the peptide is used to determine the folded fraction (unfolded m/z value is 0% folded and natively purified protein is 100% folded). Right, the unfolded (U, high m/z) and folded (F, low m/z) distributions are fitted with Gaussian curves (individual Gaussians: dashed lines, fit: red line and dots for the mean of each Gaussian) to determine the % area of the folded one. For both, the folded fractions calculated from centroid and Gaussian curve fitting are shown in purple. Use of the centroid approach avoided the fitting of very broad unfolded Gaussian peaks at later timepoints and was preferred hereafter.
- D
Refolding analysis of two peptides from regions in PpiB and PpiA at 4°C that display small D‐uptake differences between the unfolded and the folded state and only display very minor shift of the whole spectra during refolding. The centroid is depicted as a red line. Both sites did not show any distinct folding and were left out of the analysis (grey bar, Fig 3A and B).
- E
Comparing foldons from local HDX‐MS to global HDX‐MS data. The foldons from Fig 3 are displayed on top (based on t 80% or t 50%, Dataset EV5) with their formation timeline where they are coloured after formation in a time interval. If only sections (half or one third) of the foldon are formed this is indicated in the square. These foldons timelines are aligned to the global HDX‐MS data where only 1 min of refolding is shown from Fig EV2D.
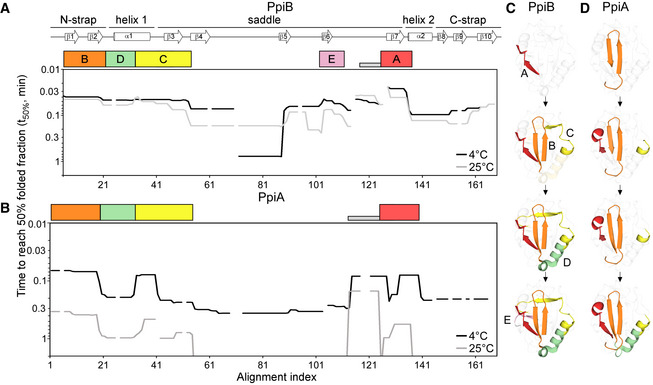
- A, B
Folding kinetics of PpiB (A) and PpiA (B) at 25 or 4°C, monitored by local HDX‐MS (Dataset EV4; n = 3 biological repeats), were analysed by PyHDX to determine the folded fractions per residue (Dataset EV5); see pipeline of analysis in Fig EV3B and folding times in Fig EV3E. For each peptide, 100% folding was set to the D‐uptake of the native protein peptide and 0% folding to the D‐uptake of the same peptide under fully deuterated conditions. Initial foldons were assigned by plotting the time needed to reach 50% of folded fraction (t50%; y‐axis; Dataset EV5) along the linear sequence (x‐axis), at both temperatures (as indicated). Only up to 1 min data are shown here (see extended dataset colour map in Appendix Fig S2; raw data in Dataset EV4). The alignment index is based on the sequence of PpiA (extended N‐tail; missing loop between β6‐β7; Appendix Fig S1D). Gaps: residues absent in one of the twins, prolines or no experimental coverage. Colour boxes below the linear secondary structure map (top) indicate foldons, named in alphabetical order. Grey bar: unstructured fast folding regions (Fig EV3D) omitted from analysis.
- C, D
Foldons, colour‐coded as in the left panels, are indicated relative to their time of formation on the PpiB (1LOP; C) and PpiA (1V9T; D) 3D structures.The indicated time points were as follows: for PpiB, 25°C (t 80% of 0.29‐0.33‐0.42‐0.47 min); for PpiB, 4°C (t 80% of 0.09‐0.29‐0.90‐1.75 min); for PpiA, 25°C (t 80% of 0.24‐0.33‐0.47‐0.51 min); for PpiA, 4°C (t 50% of 0.34‐0.55‐0.79‐0.99 min; Fig EV3E, Dataset EV5).
- A
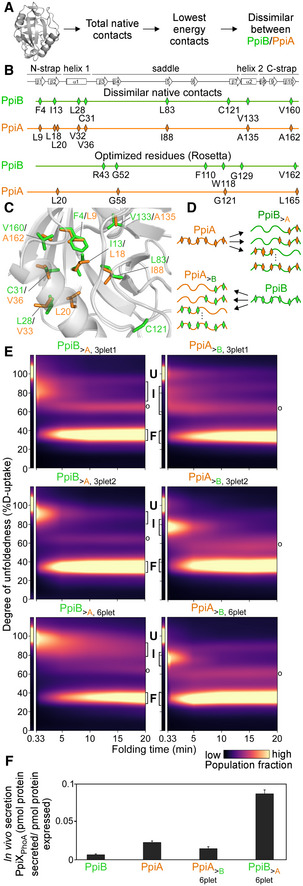
Pipeline for selecting residues that affect folding behaviour using the Frustratometer and 3D structures of PpiB (PDB 2NUL; 1LOP) and PpiA (PDB 1V9T; 1VAI; 1J2A) to test with grafting (details in Dataset EV7).
- B
Highly stabilized, dissimilar native contacts indicated on a linear map with the secondary structural elements on top.
- C
The side chains of native contact residues (green: PpiB; orange: PpiA) indicated on their 3D structure.
- D
The native contact grafting scheme between PpiB and PpiA to test their role on folding behaviour.
- E
Folding kinetics of PpiB and PpiA grafted mutants, at 4°C, as in Fig 2 (see also Dataset EV3). n = 2–4, biological repeats.
- F
In vivo secretion of the indicated PpiX‐PhoA fusion proteins in MC4100 cells carrying SecYprlA4EG. Secretion is expressed as pmol fusion protein secreted from PhoA activity calculations after removing background (uninduced cells) per pmol protein expressed from western blot analysis in 108 cells (Fig EV4E, Dataset EV9). n = 6 (biological triplicates with 3 technical replicates each, s.d.).
- A
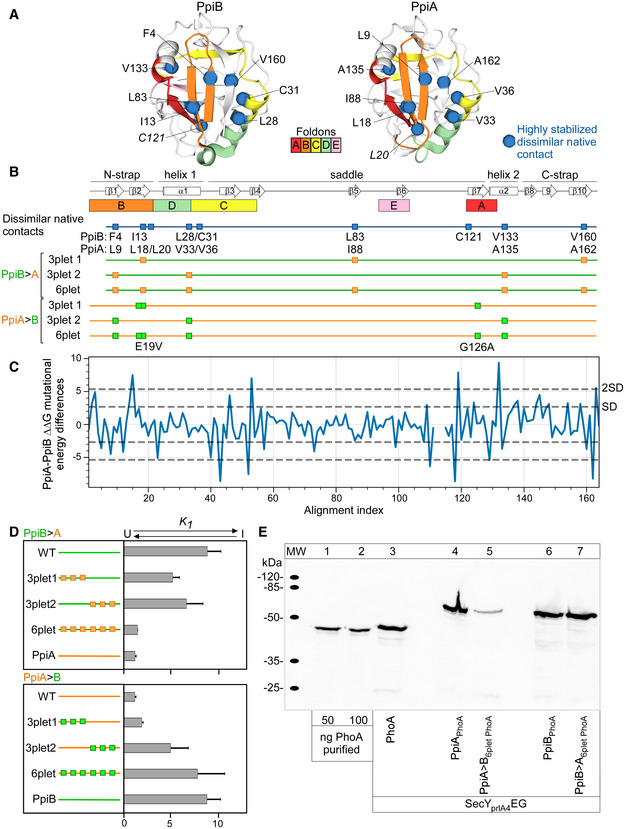
Highly stabilized native contacts that are dissimilar between PpiA and PpiB are indicated and labelled as spheres (Cα, Fig 4C) on the 3D structure of PpiB (PDB 1LOP) and PpiA (PDB 1V9T) together with the initial foldons coloured (data from 4°C, Fig 3).
- B
Mutant derivatives of PpiA (orange) or PpiB (green) with grafted residues from PpiB and PpiA (labelled PpiA>B and PpiB>A, respectively, Fig 4E) are displayed as mutations as squares below the linear map of secondary structure (PpiB, green; PpiA, orange) with annotations at the bottom.
- C
Mutational differences dddG values from in silico mutational scanning using Rosetta cartesian‐ddG application. dddGs are subtracted residue‐wise ddG values of PpiA and PpiB to compare the stability of residues between proteins.
- D
Equilibrium constant K1 of the refolding PpiB>A and PpiA>B derivatives at 4°C between the unfolded and intermediate state are shown as bar plots in rows for the grafted triplets (T) and sixplet (S) mutants compared with the wildtype (WT) proteins (calculated from Fig 4E). n = 2–4 biological repeats, s.d.
- E
In vivo protein expression in the E. coli strain MC4100 at 30°C during in vivo secretion assay detected by immunostaining with α‐PhoA antibodies on western blots (Fig 4F, See Materials and Methods, PhoA secretion activity in Dataset EV9B). ppiX‐phoA fusions carried on vector pBAD501 (ara promoter) were expressed in the cell (13.3 μM arabinose) to monitor PpiX secretion in the presence of secY prlA4 EG encoded on plasmid pET610 (lac promoter; expressed with 0.05 mM IPTG). Expression of secY prlA4 is required for secretion of proteins that have no signal peptide (Derman et al, 1993). Left, purified PhoA protein loaded at the indicated amounts was used for quantification of protein expression (Dataset EV9).
- A
Linear map of the signal peptide/early mature domain region of proPpiA.
- B
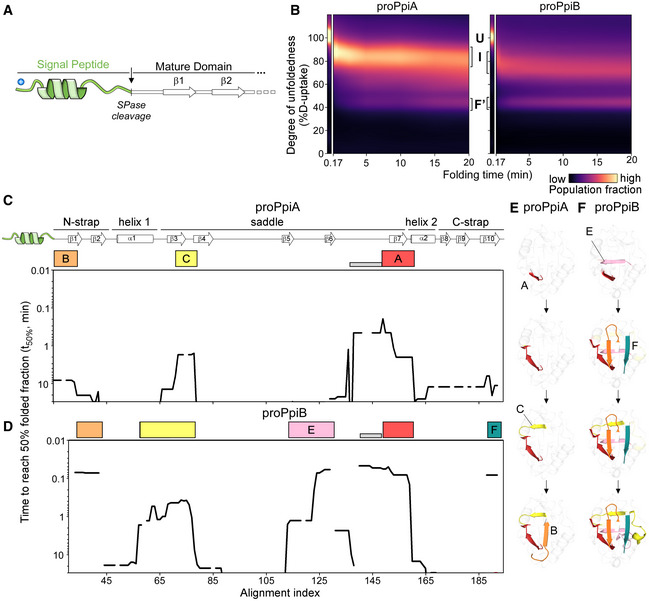
Folding kinetics of proPpiA and proPpiB (the signal peptide plus N‐terminal tail of PpiA fused to PpiB), at 25°C (as in Fig 2; rates in Dataset EV3A). n = 2 biological repeats.
- C, D
Folding kinetics of proPpiA and proPpiB, at 25°C, monitored by local HDX‐MS (Dataset EV4; n = 3 biological repeats), were analysed by PyHDX to determine the folded fractions per residue (Dataset EV5). The time needed to reach 50% of folded fraction (t 50% values; only for the mature domains shown here) was plotted as in Fig 3; see extended dataset colour map in Appendix Fig S3.
- E, F
Foldons, coloured (as in C, D) on the PpiA (1V9T; E) and PpiB (1LOP; F) 3D structures. The indicated time points are as follows: for proPpiA (t 50% of 0.9‐2.0‐2.3‐20.8 min) and for proPpiB (t 50% of 0.06‐0.08‐0.44‐1.2 min; Dataset EV5).
- A
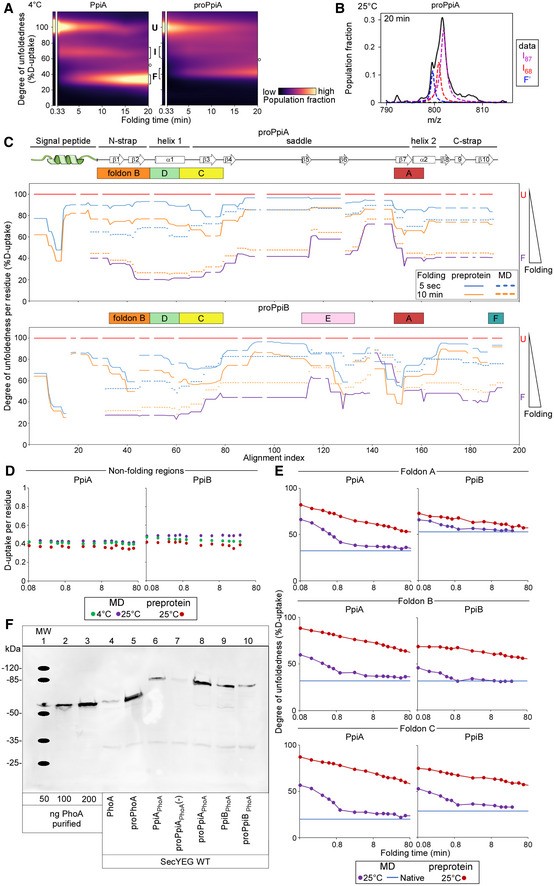
Refolding pathway of PpiA and proPpiA at 4°C. The folding populations are displayed as a continuous colour map over time based on their %D‐uptake (Dataset EV3). The unfolded state (6 M urea, left) is separated from the refolding data in 0.2 M Urea. The Unfolded (U), Intermediate (I) and Folded (F) populations are indicated with brackets. “o” refers to modifications/adducts of the folded state that are not part of the folding pathway. The left panel contains the same data and image as in Fig 2B bottom right panel and is used again here to facilitate comparison.
- B
Fitting of the two Lorentzian curves on the broad intermediate of the global HDX‐MS data of proPpiA refolding at 25°C (20 min, Fig 5B). The data were fitted with 3 folding states consisting of the I87, I68 and “folded” (F') state as annotated on the right.
- C
Degree of unfoldedness per residue of proPpiA and proPpiB (signal peptide fused using PpiA N‐terminal tail) during folding (%D‐uptake, data in Dataset EV6) where reduced degree of unfoldedness is related to gain of secondary structure that is shown on the top (based on Appendix Fig S1D). The %D‐uptake during pulse‐labelling is defined by the fully denatured control (FD; 100% D‐uptake) and shown for the preprotein (full line) and mature domain PpiA/PpiB (MD, dashed line). The degree of unfoldedness per residue of the natively folded protein is displayed in purple. Foldons are displayed on top; residues with no coverage as indicated. n = 3 biological repeats.
- D
D‐uptake of peptide in the non‐folding regions during refolding. PpiA or PpiB (green: 4°C; purple: 25°C) vs. their preprotein derivatives (25°C in dark red) display no reduction in D‐uptake during folding and remain disordered and therefore were removed from the analysis (light grey bars, Figs 3E and F, and 5C and D). The peptides of (pro)PpiA (residues 137–145, proPpiA numbering) and (pro)PpiB (residue 140–149, proPpiB numbering) are displayed. n = 3 biological repeats.
- E
Comparison of degree of unfoldedness (%D‐uptake) of peptides inside foldons between PpiA/PpiB and their preprotein derivatives (Figs 5C and D vs. 2E and F). Similar to (B), the degree of unfoldedness was determined for the whole peptide and displayed over folding time. Top, refolding of a peptide covering foldon A (β8‐α2) at 25°C for (pro)PpiA (same peptide, residue 146–157, proPpiA numbering) and (pro)PpiB (same peptide, residue 152–160, proPpiB numbering). Middle, refolding of foldon B (N‐strap) at 25°C in (pro)PpiA (same peptide, residue 24–42, proPpiA numbering) and (pro)PpiB (different peptide, residue 30–45 and 24–43, respectively, proPpiB numbering). Bottom, refolding of foldon C (end of α1) at 25°C for (pro)PpiA (same peptide, residue 56–64, proPpiA numbering) and (pro)PpiB (different peptide, residue 43–59 and 44–59, respectively, proPpiB numbering).
- F
In vivo protein expression in the E. coli strain MC4100 at 30°C detected by immunostaining with α‐PhoA antibodies on western blots (PhoA secretion activity in Dataset EV9B). Transcription of ppiX‐phoA fusions carried on vector pBAD501 was induced in the cell (6.67 μM arabinose) and monitor PpiX secretion monitored (Fig 6A). Lanes 1–3, purified PhoA protein loaded at the indicated amounts used for quantification of protein expression. “‐”: uninduced cells containing the vector with the indicated constructs.
- A
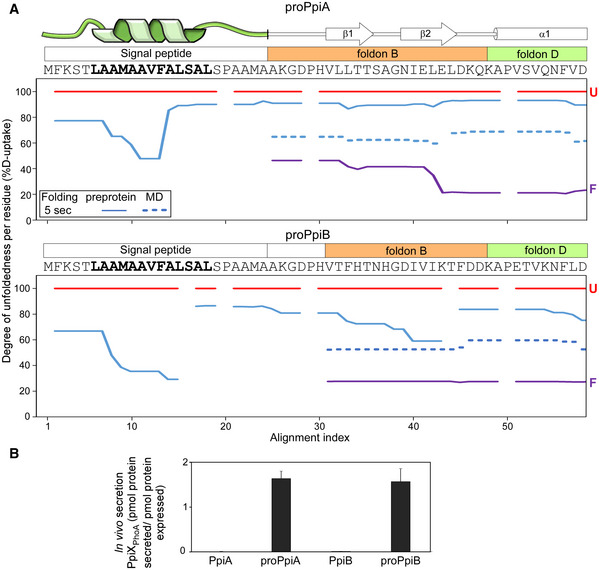
Folding kinetics of proPpiA and proPpiB, monitored by local HDX‐MS (Dataset EV4; n = 3 biological repeats), were analysed by PyHDX to determine the degree of unfoldedness per residue (Dataset EV6; Fig EV5C). %D‐uptake for the 5‐s folding time, at 25°C (y‐axis) for the indicated N‐terminal regions (PpiA N‐tail included in proPpiB, predicted signal peptide helix in bold) were plotted along the aligned sequences (x‐axis). Reduced %D‐uptake relative to the U state (red) indicates gain of secondary structure. Top; signal peptide, foldons (B and D) (Appendix Fig S1D; see also Dataset EV6; Fig EV5C). Red: unfolded pre‐forms, purple: native proteins. Gaps: No coverage.
- B
In vivo secretion of the indicated PpiX‐PhoA fusions by the wildtype SecYEG (as in Fig 4F, data in Dataset EV9B). Expression levels in Fig EV5F. n = 6 (biological triplicates with 3 technical replicates each, s.d.).
References
-
- Akiyama Y, Ito K (1993) Folding and assembly of bacterial alkaline phosphatase in vitro and in vivo. J Biol Chem 268: 8146–8150 - PubMed
Publication types
MeSH terms
Substances
Associated data
- Actions
- Actions
- Actions
- Actions
- Actions
LinkOut - more resources
Full Text Sources
Other Literature Sources
