

On side-chain conformational entropy of proteins
- PMID: 17154716
- PMCID: PMC1676032
- DOI: 10.1371/journal.pcbi.0020168
On side-chain conformational entropy of proteins
Abstract
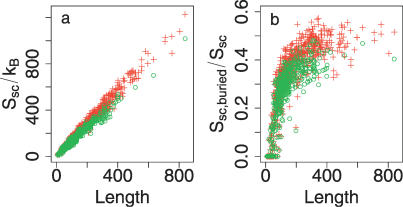
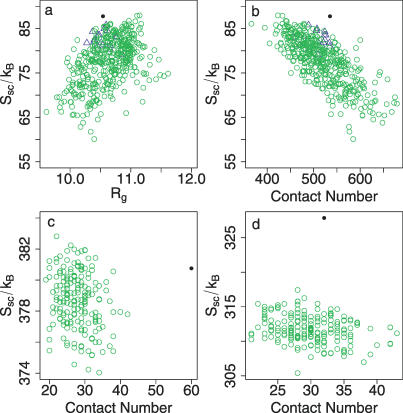
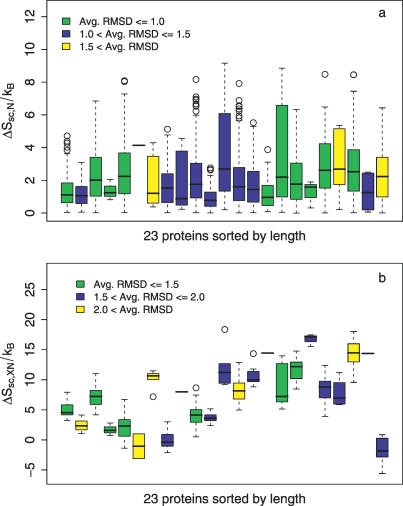
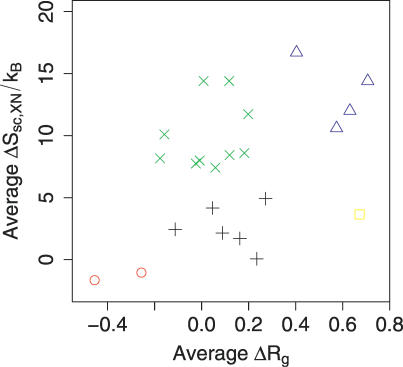
The role of side-chain entropy (SCE) in protein folding has long been speculated about but is still not fully understood. Utilizing a newly developed Monte Carlo method, we conducted a systematic investigation of how the SCE relates to the size of the protein and how it differs among a protein's X-ray, NMR, and decoy structures. We estimated the SCE for a set of 675 nonhomologous proteins, and observed that there is a significant SCE for both exposed and buried residues for all these proteins-the contribution of buried residues approaches approximately 40% of the overall SCE. Furthermore, the SCE can be quite different for structures with similar compactness or even similar conformations. As a striking example, we found that proteins' X-ray structures appear to pack more "cleverly" than their NMR or decoy counterparts in the sense of retaining higher SCE while achieving comparable compactness, which suggests that the SCE plays an important role in favouring native protein structures. By including a SCE term in a simple free energy function, we can significantly improve the discrimination of native protein structures from decoys.
Conflict of interest statement
Figures
References
-
- Vasquez M. Modeling side-chain conformation. Curr Opin Struct Biol. 1996;6:217–221. - PubMed
-
- Pickett SD, Sternberg MJ. Empirical scale of side-chain conformational entropy in protein folding. J Mol Biol. 1993;231:825–839. - PubMed
-
- Creamer TP. Side-chain conformational entropy in protein unfolded states. Proteins. 2000;40:443–450. - PubMed
-
- Yu YB, Lavigne P, Privalov PL, Hodges RS. The measure of interior disorder in a folded protein and its contribution to stability. J Am Chem Soc. 1999;121:8443–8449.
Publication types
MeSH terms
Substances
Associated data
- Actions
- Actions
- Actions
- Actions
- Actions
- Actions
- Actions
- Actions
- Actions
- Actions
- Actions
- Actions
- Actions
- Actions
- Actions
- Actions
- Actions
- Actions
- Actions
- Actions
- Actions
- Actions
- Actions
- Actions
- Actions
- Actions
- Actions
- Actions
- Actions
- Actions
- Actions
- Actions
- Actions
- Actions
- Actions
- Actions
- Actions
- Actions
- Actions
- Actions
- Actions
- Actions
- Actions
- Actions
- Actions
- Actions
LinkOut - more resources
Full Text Sources
Research Materials
