. 2019 Aug 30;294(35):13006-13016.
doi: 10.1074/jbc.RA119.007730. Epub 2019 Jul 11.

Cross-reactivity of a rice NLR immune receptor to distinct effectors from the rice blast pathogen Magnaporthe oryzae provides partial disease resistance

Affiliations

Cross-reactivity of a rice NLR immune receptor to distinct effectors from the rice blast pathogen Magnaporthe oryzae provides partial disease resistance

Freya A Varden et al. J Biol Chem. .

Abstract

Unconventional integrated domains in plant intracellular immune receptors of the nucleotide-binding leucine-rich repeat (NLRs) type can directly bind translocated effector proteins from pathogens and thereby initiate an immune response. The rice (Oryza sativa) immune receptor pairs Pik-1/Pik-2 and RGA5/RGA4 both use integrated heavy metal-associated (HMA) domains to bind the effectors AVR-Pik and AVR-Pia, respectively, from the rice blast fungal pathogen Magnaporthe oryzae These effectors both belong to the MAX effector family and share a core structural fold, despite being divergent in sequence. How integrated domains in NLRs maintain specificity of effector recognition, even of structurally similar effectors, has implications for understanding plant immune receptor evolution and function. Here, using plant cell death and pathogenicity assays and protein-protein interaction analyses, we show that the rice NLR pair Pikp-1/Pikp-2 triggers an immune response leading to partial disease resistance toward the "mis-matched" effector AVR-Pia in planta and that the Pikp-HMA domain binds AVR-Pia in vitro We observed that the HMA domain from another Pik-1 allele, Pikm, cannot bind AVR-Pia, and it does not trigger a plant response. The crystal structure of Pikp-HMA bound to AVR-Pia at 1.9 Å resolution revealed a binding interface different from those formed with AVR-Pik effectors, suggesting plasticity in integrated domain-effector interactions. The results of our work indicate that a single NLR immune receptor can bait multiple pathogen effectors via an integrated domain, insights that may enable engineering plant immune receptors with extended disease resistance profiles.

Keywords: Nod-like receptor (NLR); effector; host-pathogen interaction; plant biochemistry; plant defense; plant immunity; protein structure; rice; rice blast disease.


Conflict of interest statement

The authors declare that they have no conflicts of interest with the contents of this article

Figures
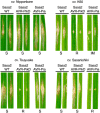
Figure 1.
Figure 1.
Pikp confers partial resistance to M. oryzae expressing AVR–Pia. Images of rice leaves following spot-inoculation assays of Sasa2 M. oryzae strain expressing no effectors (WT), AVR–PikD, or AVR–Pia. Strains were inoculated onto rice cultivars containing either Pikp-1/Pikp-2 (cv. K60), Pikm-1/Pikm-2 (cv. Tsuyuake), RGA5/RGA4 (cv. Sasanishiki) or none of the above (cv. Nipponbare). S = susceptible; R = resistant; IM = intermediate, and all are qualitative phenotype descriptors based on observations. Leaf samples were harvested 10 days post-inoculation. The assays were repeated at least three times with similar results.
Figure 2.
Figure 2.
Pikp, but not Pikm, responds weakly to AVR–Pia when transiently expressed in N. benthamiana. N. benthamiana leaves were visually scored for macroscopic cell death 5 days post-infiltration using the previously published scoring scale (11) from 0 to 6. Representative leaf image shows cell death as autofluorescence under UV light (note: data not used for dot plot). Dot plots each show 70 repeats of the cell-death assay (10, 30, and 30 technical repeats over three independent experiments). The size of the center dot at each cell death value is directly proportional to the number of replicates in the sample with that score. All individual data points are represented as dots, colored by independent repeats. Western blottings show protein accumulation following transient expression in N. benthamiana 5 days post-agroinfiltration and are representative of three biological repeats (the amount of protein in the Pik-1/Pik-2/AVR–PikD samples appears lower (as indicated in the Ponceau image for total loading) due to greater cell death in this sample, limiting protein accumulation). A, Pikp-1/Pikp-2 transiently expressed with AVR–PikD, AVR–PikDH46E, and AVR–Pia. B, Pikm-1/Pikm-2 transiently expressed with AVR–PikD, AVR–PikDH46E, and AVR–Pia.
Figure 3.
Figure 3.
Pikp–HMA, but not Pikm–HMA, binds AVR–Pia in vitro. A, analytical gel-filtration traces assessing complex formation of Pikp–HMA (top panel) and Pikm–HMA (bottom panel) with AVR–Pia. Elution volumes for AVR–Pia alone (pink) and when mixed with Pikp–HMA (blue) and Pikm–HMA (gold) are labeled. Earlier elution indicates a larger molecular mass. The void volume of the column is 7.4 ml. SDS-PAGE analysis of eluent at the relevant volumes is shown in Fig. S1. The absorbance observed is only due to the effectors, as Pik–HMA domains do not absorb light at the wavelength measured. The interaction between Pik–HMAs and AVR–PikD was shown previously (11, 12). B, surface plasmon resonance data showing Rmax (%) (the percentage of theoretical maximum response for HMA binding to immobilized effector) for Pikp–HMA (left panel) and Pikm–HMA (right panel) at 100 nm concentration binding to AVR–PikD, AVR–PikC, or AVR–Pia. Based on previously published data (12), binding was assumed to be 2:1 for Pikp–HMA with AVR–PikD and AVR–PikC, and 1:1 for all other interactions. Box plots show data for three repeats carried out in triplicate, where data points for each repeat are shown as a different shape. Note that only eight data points are shown for Pikp–HMA with the negative control AVR–PikC, due to poor effector capture in a single run. Equivalent data for 40 and 4 nm HMA concentrations are shown in Figs. S1 and S2.
Figure 4.
Figure 4.
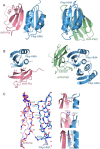
Structural basis of Pikp–HMA interaction with AVR–Pia. A, schematic diagram of the structure of Pikp–HMA in complex with AVR–Pia refined to 1.9 Å resolution by X-ray crystallography (left), compared with the structure of Pikp–HMA in complex with AVR–PikD (PDB code 6G10, right, only a Pikp–HMA monomer is displayed here). AVR–Pia is shown in pink, AVR–PikD in green, and Pikp–HMA in blue. The Pikp–HMA monomer is shown in the same orientation for both structures. B, alternative view (rotated ∼90 °C horizontally and vertically) of the Pikp–HMA/AVR–Pia and Pikp–HMA/AVR–PikD structures shown in A, with secondary structure features labeled (Pikp–HMA dimer structure shown in this view). C, details of the interface between Pikp–HMA and AVR–Pia, showing interactions at the peptide backbone (left), and selected side-chain interactions (right). Dotted lines show hydrogen bonds, and red spheres represent water molecules. Carbons are colored according to the protein (Pikp–HMA in blue and AVR–Pia in pink) with oxygen atoms shown in red and nitrogen in dark blue. Labels show the single letter amino acid code with position in the peptide chain. Bond distances for hydrogen bonds shown are 2.80, 3.05, 2.81, and 3.06 Å (left panel, top to bottom), and 2.87 Å (right panel, top), 3.0/2.86 Å (right panel, middle), and 2.66/3.05 Å (right panel, bottom).
Figure 5.
Figure 5.
Modifying AVR–Pia with the N-terminal extension of AVR–PikD does not affect the Pik NLR response. N. benthamiana leaves were visually scored for cell death 5 days post-infiltration using the previously published scoring scale (11) from 0 to 6. Representative leaf image shows cell death as autofluorescence under UV light. Dot plots each show 70 repeats of the cell-death assay (10, 30, and 30 technical repeats over three independent experiments). The size of the center dot at each cell death value is directly proportional to the number of replicates in the sample with that score. All individual data points are represented as dots, colored by independent repeat. Western blots show protein accumulation following transient expression in N. benthamiana 5 days post-agroinfiltration and are representative of three biological repeats (the amount of protein in the Pik-1/Pik-2/AVR–PikD samples appears lower (as indicated in the Ponceau image for total loading) due to greater cell death in this sample, limiting protein accumulation). A, Pikp-1/Pikp-2 transiently expressed with AVR–PikD, AVR–PikDH46E, AVR–Pia, AVR–PiaNAVR–PikD, and AVR–PikDΔ22–52. B, Pikm-1/Pikm-2 transiently expressed with AVR–PikD, AVR–PikDH46E, AVR–Pia, AVR–PiaNAVR–PikD, and AVR–PikDΔ22–52. The data shown for AVR–PikD, AVR–PikDH46E, and AVR–Pia is the same as shown in Fig. 2, to give direct comparison (all of these data were acquired within the same experimental repeats).
Figure 6.
Figure 6.
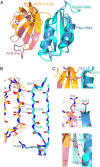
Structural comparison of Pikp–HMA/AVR–Pia and RGA5–HMA/AVR1–CO39 complexes. Overlays of Pikp–HMA/AVR–Pia with RGA5–HMA/AVR1–CO39 (PDB code 5ZNG) are superposed on the HMA domain (root mean square deviation 0.81 Å over 73 residues). AVR–Pia is shown in pink, Pikp–HMA in blue, AVR1–CO39 in orange, and RGA5–HMA in turquoise. A, cartoon ribbon structure represents overall structures. B, details of interactions between the peptide backbones at the interface. Dotted lines show hydrogen bonds, and carbons are colored according to the chain with oxygen atoms shown in red and nitrogen in dark blue. Labels show the single letter amino acid code (colored according to protein) with position in the peptide chain. * indicates a side chain, rather than backbone interaction. C, further details of important interactions are at the interfaces. Red spheres represent water molecules.

References

    1. Dodds P. N., and Rathjen J. P. (2010) Plant immunity: towards an integrated view of plant–pathogen interactions. Nat. Rev. Genet. 11, 539–548 10.1038/nrg2812 - DOI - PubMed
    1. Jones J. D., Vance R. E., and Dangl J. L. (2016) Intracellular innate immune surveillance devices in plants and animals. Science 354, aaf6395 10.1126/science.aaf6395 - DOI - PubMed
    1. Spoel S. H., and Dong X. (2012) How do plants achieve immunity? Defence without specialized immune cells. Nat. Rev. Immunol. 12, 89–100 10.1038/nri3141 - DOI - PubMed
    1. Cesari S. (2018) Multiple strategies for pathogen perception by plant immune receptors. New Phytol. 219, 17–24 10.1111/nph.14877 - DOI - PubMed
    1. Kourelis J., and van der Hoorn R. A. L. (2018) Defended to the nines: 25 years of resistance gene cloning identifies nine mechanisms for R protein function. Plant Cell 30, 285–299 10.1105/tpc.17.00579 - DOI - PMC - PubMed

Publication types