. 2007 Dec 7;374(4):1017-28.
doi: 10.1016/j.jmb.2007.09.078. Epub 2007 Oct 3.

Crystal structures of the luciferase and green fluorescent protein from Renilla reniformis

Affiliations

Crystal structures of the luciferase and green fluorescent protein from Renilla reniformis

Andreas Markus Loening et al. J Mol Biol. .

Abstract

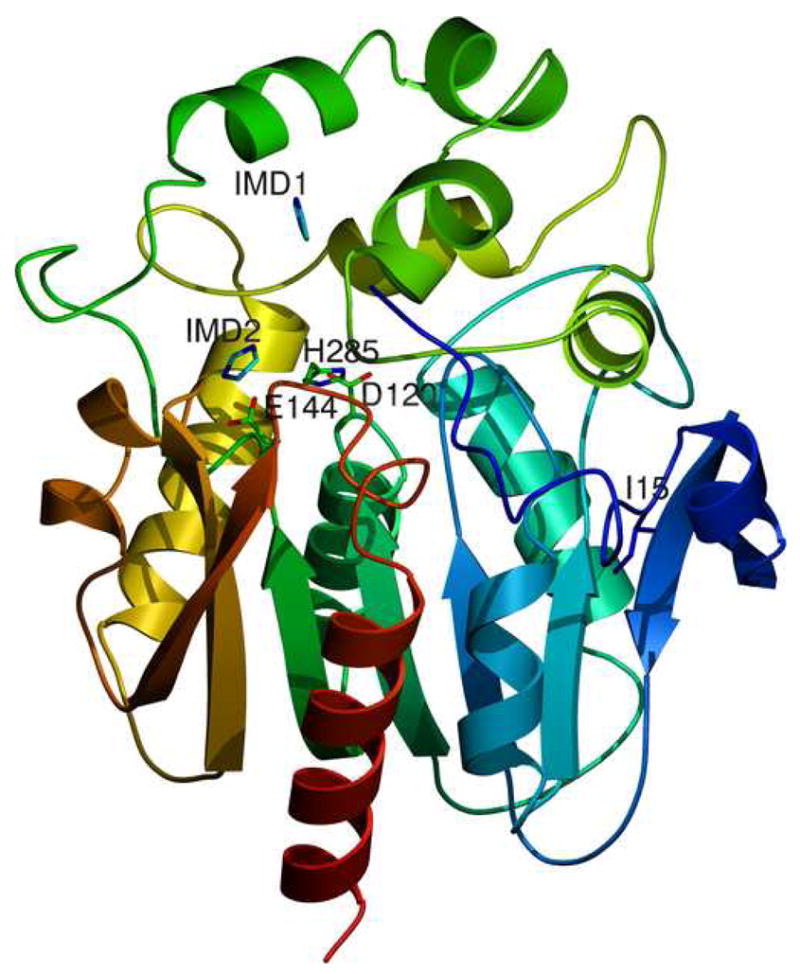
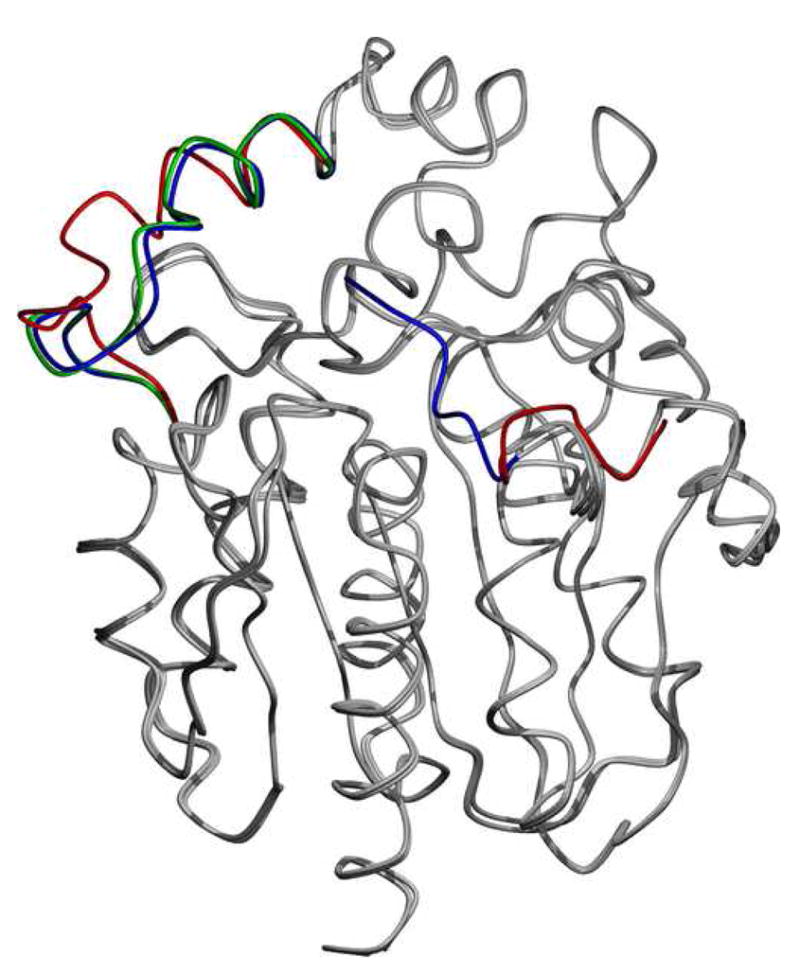
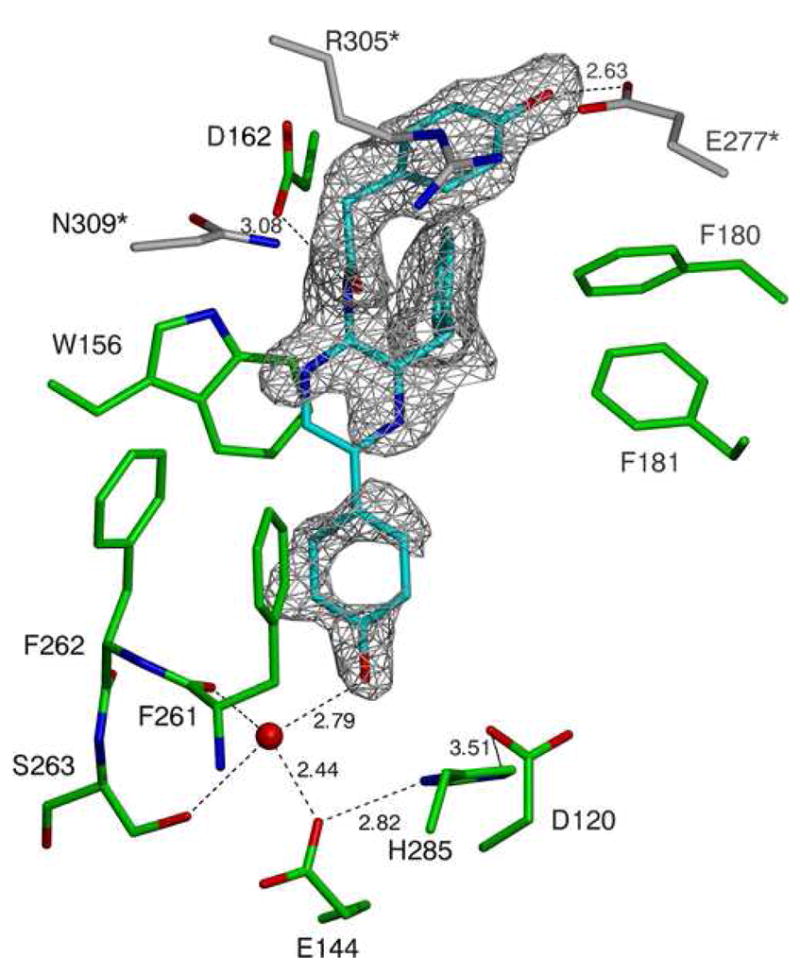
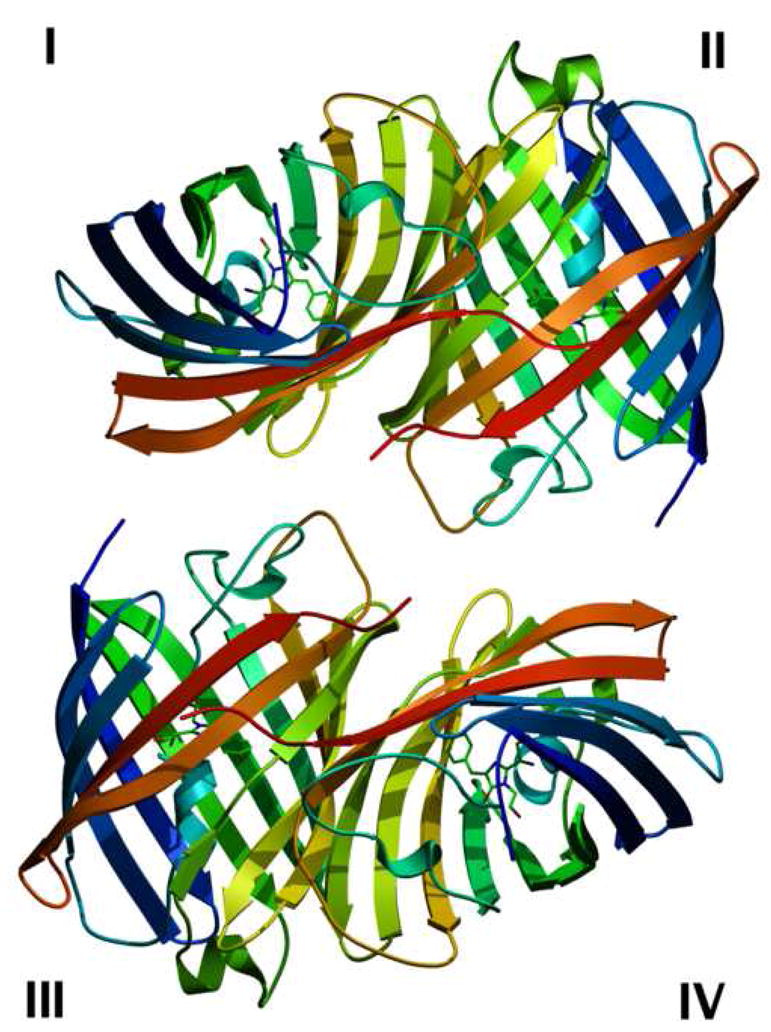
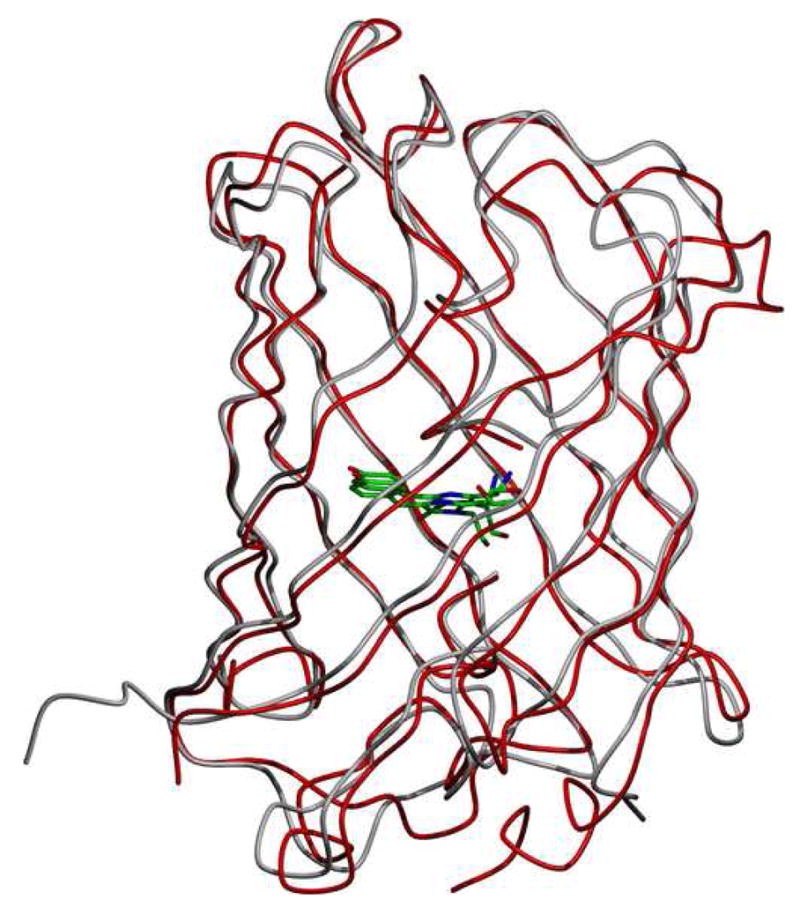
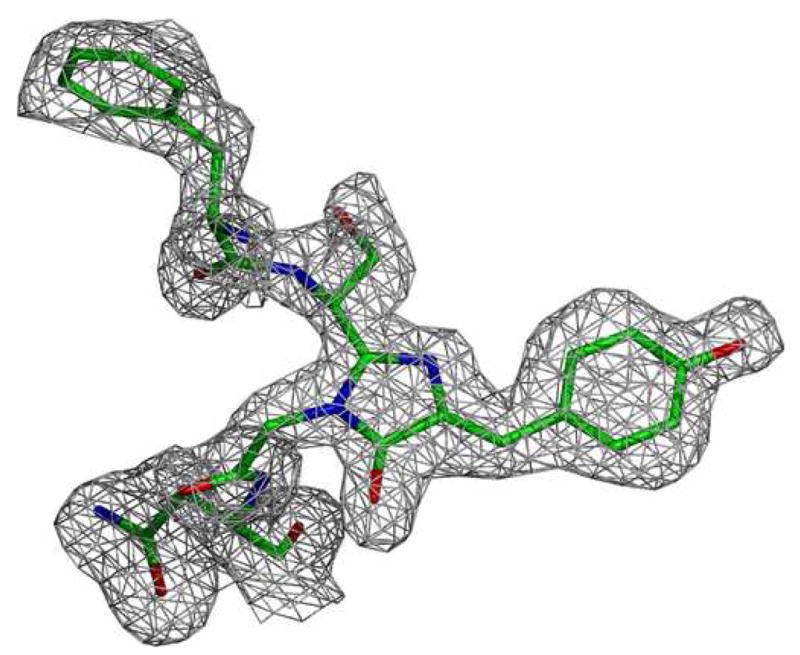
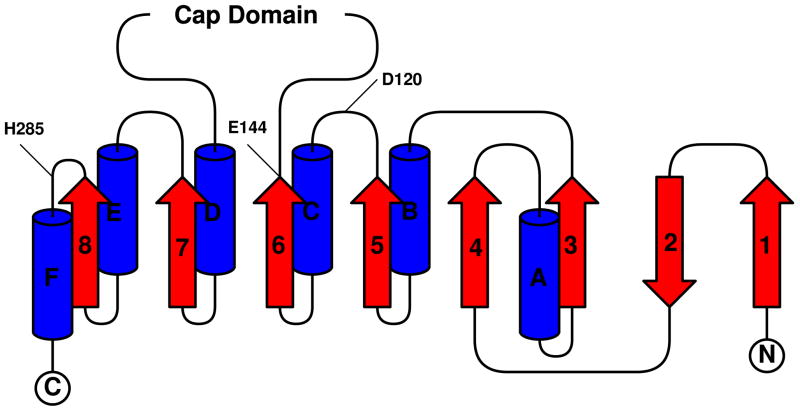
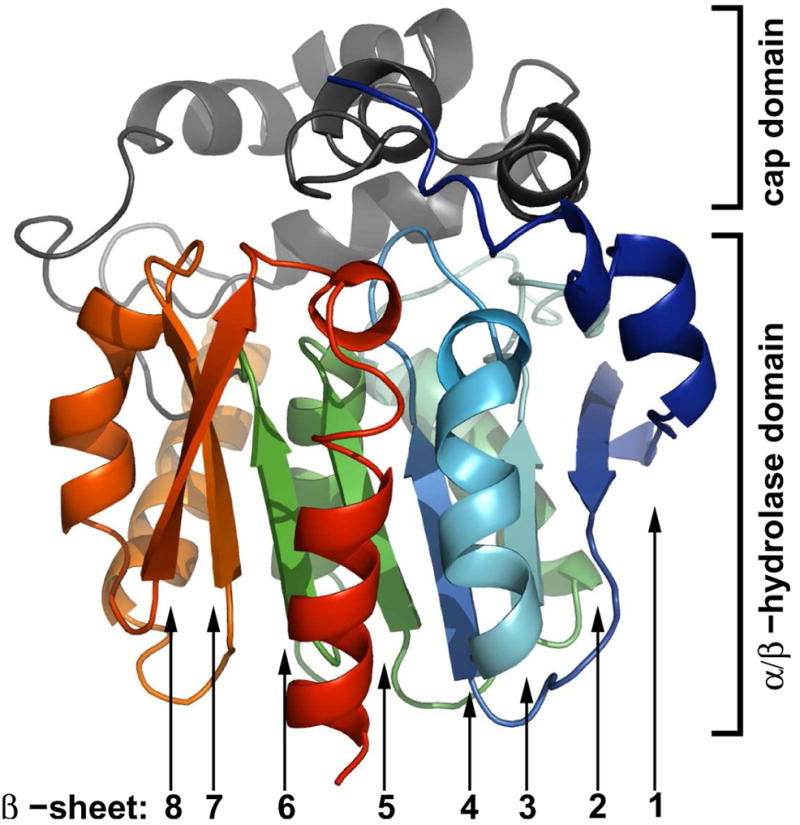
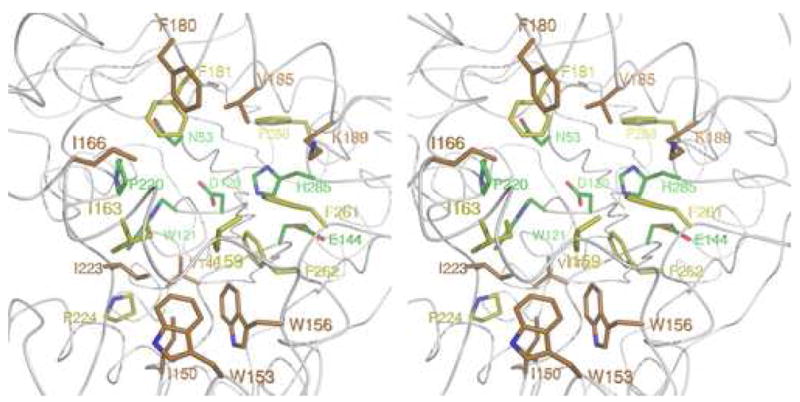
Due to its ability to emit light, the luciferase from Renilla reniformis (RLuc) is widely employed in molecular biology as a reporter gene in cell culture experiments and small animal imaging. To accomplish this bioluminescence, the 37-kDa enzyme catalyzes the degradation of its substrate coelenterazine in the presence of molecular oxygen, resulting in the product coelenteramide, carbon dioxide, and the desired photon of light. We successfully crystallized a stabilized variant of this important protein (RLuc8) and herein present the first structures for any coelenterazine-using luciferase. These structures are based on high-resolution data measured to 1.4 A and demonstrate a classic alpha/beta-hydrolase fold. We also present data of a coelenteramide-bound luciferase and reason that this structure represents a secondary conformational form following shift of the product out of the primary active site. During the course of this work, the structure of the luciferase's accessory green fluorescent protein (RrGFP) was also determined and shown to be highly similar to that of Aequorea victoria GFP.


Figures

Figure 1
Figure 1
Structure of the luciferase from Renilla reniformis 1a Cartoon representation of the structure derived from the RLuc8:diammonium condition. Residues 4–308 of RLuc8 are shown, with the N-terminus (N) in blue and the C-terminus (C) in red. The presumptive catalytic triad residues of D120, E144, and H285 [22] are marked, along with the two imidazole molecules (IMD1, IMD2) present in the structure. Also marked is the residue I15 mentioned in the discussion. 1b Superposition of the two monomers from the S3Rluc8:thiomaltoside condition and the diammonium structure. Regions that differ are the N-terminal domain and the loop domain over the active site. The regions of deviations are highlighted with blue for the diammonium condition, and red and green for monomers 1 and 2 of the thiomaltoside condition, respectively. Other than these two regions, the proteins are almost identical (Cα root mean square deviation <0.4 Å). 1c A close-up cartoon representation of the active site of the structure derived from the RLuc8:PEG/isopropanol condition. Coelenteramide is shown in cyan, residues from the luciferase molecule binding the coelenteramide are shown in green, and residues from the neighboring luciferase (via crystallographic contacts) are shown in gray. The red spheres represent water molecules, and the black dashed lines represent predicted hydrogen bonds. The gray mesh represents a σA weighted Fo - Fc difference map before the inclusion of the coelenteramide in the model phases, contoured at 2.0σ.
Figure 1
Figure 1
Structure of the luciferase from Renilla reniformis 1a Cartoon representation of the structure derived from the RLuc8:diammonium condition. Residues 4–308 of RLuc8 are shown, with the N-terminus (N) in blue and the C-terminus (C) in red. The presumptive catalytic triad residues of D120, E144, and H285 [22] are marked, along with the two imidazole molecules (IMD1, IMD2) present in the structure. Also marked is the residue I15 mentioned in the discussion. 1b Superposition of the two monomers from the S3Rluc8:thiomaltoside condition and the diammonium structure. Regions that differ are the N-terminal domain and the loop domain over the active site. The regions of deviations are highlighted with blue for the diammonium condition, and red and green for monomers 1 and 2 of the thiomaltoside condition, respectively. Other than these two regions, the proteins are almost identical (Cα root mean square deviation <0.4 Å). 1c A close-up cartoon representation of the active site of the structure derived from the RLuc8:PEG/isopropanol condition. Coelenteramide is shown in cyan, residues from the luciferase molecule binding the coelenteramide are shown in green, and residues from the neighboring luciferase (via crystallographic contacts) are shown in gray. The red spheres represent water molecules, and the black dashed lines represent predicted hydrogen bonds. The gray mesh represents a σA weighted Fo - Fc difference map before the inclusion of the coelenteramide in the model phases, contoured at 2.0σ.
Figure 2
Figure 2
Structure of the green fluorescent protein from Renilla reniformis (RrGFP). The condition used is labeled as RrGFP:PEG/MPD in Table 1. Residues from 7–226 (of 233 total) were identified in the data. 2a Cartoon representation of a single unit cell of the RrGFP crystal. The four protomers in each unit cell are labeled I–IV. For each protomer, its N-terminus is shown in blue and its C-terminus is shown in red. 2b Superposition of RrGFP and the GFP from Aequorea victoria (AvGFP). The molecule at the center of the β-barrel is the fluorophore. The primary sequences of the two GFPs are 28% identical and 50% similar. PDB ID 1EMA was used for the AvGFP structure [58]. 2c Close-up cartoon representation of the RrGFP fluorophore. The gray mesh represents a σA weighted FoFc difference map before the inclusion of the coelenteramide in the model phases, contoured at 2.0σ.
Figure 2
Figure 2
Structure of the green fluorescent protein from Renilla reniformis (RrGFP). The condition used is labeled as RrGFP:PEG/MPD in Table 1. Residues from 7–226 (of 233 total) were identified in the data. 2a Cartoon representation of a single unit cell of the RrGFP crystal. The four protomers in each unit cell are labeled I–IV. For each protomer, its N-terminus is shown in blue and its C-terminus is shown in red. 2b Superposition of RrGFP and the GFP from Aequorea victoria (AvGFP). The molecule at the center of the β-barrel is the fluorophore. The primary sequences of the two GFPs are 28% identical and 50% similar. PDB ID 1EMA was used for the AvGFP structure [58]. 2c Close-up cartoon representation of the RrGFP fluorophore. The gray mesh represents a σA weighted FoFc difference map before the inclusion of the coelenteramide in the model phases, contoured at 2.0σ.
Figure 3
Figure 3
3a The topology of RLuc8’s α/β-hydrolase fold domain. α-helices are shown in blue, and β-sheets are shown in red. Numbering/lettering of the sheets/helices is done with respect to the standard for α/β-hydrolases [33], and the locations of the presumptive catalytic residues are marked. The cap domain is an excursion from the fold pattern comprised of residues 146–230 in the the luciferase. 3b The domains of RLuc8. Shown are the location of the cap domain (in gray) and α/β-hydrolase fold domain (blue to red) in the context of the crystal structure. 3c A close-up stereo cartoon representation of the active site of the RLuc8:diammonium structure. The presumptive active site residues are color coded with respect to the average degree of enzymatic perturbation mutagenesis at the site yields, based on previously published data [22,23]. Mutations at green, yellow, and orange colored residues were associated with <1%, 1–10%, or 10–100% of full enzymatic activity, respectively.
Figure 3
Figure 3
3a The topology of RLuc8’s α/β-hydrolase fold domain. α-helices are shown in blue, and β-sheets are shown in red. Numbering/lettering of the sheets/helices is done with respect to the standard for α/β-hydrolases [33], and the locations of the presumptive catalytic residues are marked. The cap domain is an excursion from the fold pattern comprised of residues 146–230 in the the luciferase. 3b The domains of RLuc8. Shown are the location of the cap domain (in gray) and α/β-hydrolase fold domain (blue to red) in the context of the crystal structure. 3c A close-up stereo cartoon representation of the active site of the RLuc8:diammonium structure. The presumptive active site residues are color coded with respect to the average degree of enzymatic perturbation mutagenesis at the site yields, based on previously published data [22,23]. Mutations at green, yellow, and orange colored residues were associated with <1%, 1–10%, or 10–100% of full enzymatic activity, respectively.

References

    1. Contag CH, Spilman SD, Contag PR, Oshiro M, Eames B, Dennery P, Stevenson DK, Benaron DA. Visualizing gene expression in living mammals using a bioluminescent reporter. Photochem Photobiol. 1997;66:523–531. - PubMed
    1. Viviani VR. The origin, diversity, and structure function relationships of insect luciferases. Cell Mol Life Sci. 2002;59:1833–1850. - PMC - PubMed
    1. Nakatsu T, Ichiyama S, Hiratake J, Saldanha A, Kobashi N, Sakata KKH. Structural basis for the spectral difference in luciferase bioluminescence. Nature. 2006;440:372–376. - PubMed
    1. Markova SV, Golz S, Frank LA, Kalthof B, Vysotski ES. Cloning and expression of cDNA for a luciferase from the marine copepod Metridia longa. J Biol Chem. 2004;279:3212–3217. - PubMed
    1. Matthews JC, Hori K, Cormier MJ. Purification and properties of Renilla reniformis luciferase. Biochemistry. 1977;16:85–91. - PubMed

Publication types

LinkOut - more resources