. 2021 Aug 30;4(11):e202101034.
doi: 10.26508/lsa.202101034. Print 2021 Nov.

High levels of TFAM repress mammalian mitochondrial DNA transcription in vivo

Affiliations

High levels of TFAM repress mammalian mitochondrial DNA transcription in vivo

Nina A Bonekamp et al. Life Sci Alliance. .

Abstract

Mitochondrial transcription factor A (TFAM) is compacting mitochondrial DNA (dmtDNA) into nucleoids and directly controls mtDNA copy number. Here, we show that the TFAM-to-mtDNA ratio is critical for maintaining normal mtDNA expression in different mouse tissues. Moderately increased TFAM protein levels increase mtDNA copy number but a normal TFAM-to-mtDNA ratio is maintained resulting in unaltered mtDNA expression and normal whole animal metabolism. Mice ubiquitously expressing very high TFAM levels develop pathology leading to deficient oxidative phosphorylation (OXPHOS) and early postnatal lethality. The TFAM-to-mtDNA ratio varies widely between tissues in these mice and is very high in skeletal muscle leading to strong repression of mtDNA expression and OXPHOS deficiency. In the heart, increased mtDNA copy number results in a near normal TFAM-to-mtDNA ratio and maintained OXPHOS capacity. In liver, induction of LONP1 protease and mitochondrial RNA polymerase expression counteracts the silencing effect of high TFAM levels. TFAM thus acts as a general repressor of mtDNA expression and this effect can be counterbalanced by tissue-specific expression of regulatory factors.


Conflict of interest statement

N-G Larsson is a scientific founder and holds stock in Pretzel Therapeutics, Inc.

Figures

Figure 1.
Figure 1.. Moderate increase in TFAM levels leads to increased mtDNA copy number without effects on mitochondrial gene expression.
(A) Overview of the bacterial artificial chromosome (BAC) construct expressing mouse Tfam under its endogenous promoter. Green boxes indicate Tfam exons. A neutral point mutation generating a PvuI restriction site was introduced to distinguish the BAC from the Tfam wild-type locus (indicated as C to G in the magnified exon). (B) Western blot analysis of TFAM protein levels in the heart, liver, and skeletal muscle whole cell lysates of wild-type (Con) and BAC-TFAM TG 137 (+/BAC) animals. The BAC TG 137 founder line is used in all subsequent experiments and referred to as +/BAC. Actin was used as a loading control. A representative image is shown (n = 3 independent experiments). (C) Quantification of steady-state mtDNA levels in the heart, liver, and skeletal muscle of wild-type (Con) and BAC-TFAM (+/BAC) animals. In the case of heart and liver, mtDNA levels were quantified by qPCR using specific probes against COX1 and 18S. Quantification of skeletal muscle mtDNA levels was performed by densitometric analysis of Southern blots. Data are expressed as means ± SEM (n = 9–12 biological replicates for heart and liver; n = 8 for skeletal muscle; P < 0.01: **; P < 0.0001: ****, two-way ANOVA with Sidak’s test for multiple comparisons). (D) Southern blot analysis of PstI-digested mtDNA derived from the heart, liver, and skeletal muscle of wild-type (Con) and BAC-TFAM (+/BAC) animals. mtDNA was quantified by radiolabeling with a specific probe against COX1, nuclear DNA was probed with 18S. A representative image is shown (n = 3 independent experiments). (E) Analysis of steady-state mitochondrial transcript levels in heart and liver of wild-type (Con) and BAC-TFAM (+/BAC) animals by qRT-PCR. Mitochondrial mRNAs and rRNAs were quantified using specific mouse probes, β-2-microglobulin was used as a reference gene. (n = 4–5 biological replicates). (F) Western blot analysis of steady-state levels of respiratory chain subunits in the heart, liver, and skeletal muscle mitochondrial extracts of wild-type (Con) and BAC-TFAM (+/BAC) animals. A representative image is shown (n = 3 independent experiments). (G, H) Phenotyping/energy homeostasis of BAC-TFAM mice aged 10 and 52 wk. Cohorts of BAC-TFAM mice (+/BAC) and wild-type litter mates (Con) were analysed by indirect calorimetry at the age of 10 and 52 wk. Data on respiratory exchange rate (RER, [G]) and activity (sum of ambulatory and fine movement, [H]) are shown (means ± SEM, n = 5–8 biological replicates; P < 0.01: **; P < 0.001: ***, Two-way ANOVA with Sidak’s test for multiple comparisons). Source data are available for this figure.
Figure S1.
Figure S1.. The bacterial artificial chromosome (BAC)–TFAM phenotype is consistent between individual founders.
(A) Western blot analysis of TFAM protein levels in the heart, liver, and skeletal muscle whole cell lysates of wild-type and BAC-TFAM animals derived from different founders. Different founder lines (BAC TG 188, TG 137, and TG 91) were generated and analysed for TFAM protein expression. All founders overexpress TFAM at a moderate level in the investigated tissues. Actin was used as a loading control. (B) TFAM protein levels in wild-type and the different BAC-TFAM animals were quantified by densitometry and are expressed as folds of control (means ± SEM, n = 9–12 biological replicates for controls, 5–6 biological replicates for BAC founder lines; P < 0.05: *, P < 0.01:**, two-way ANOVA with Sidak’s test for multiple comparisons). (C) Quantification of steady-state mtDNA levels in the heart, liver, and skeletal muscle of wild-type (Con) and BAC-TFAM animals derived from different founders (TG 188, TG 137, TG 91). In the case of heart and liver, mtDNA levels were quantified by qPCR using specific probes against COX1 and 18S. Quantification of skeletal muscle mtDNA levels was performed by densitometric analysis of Southern blots. Data are expressed as means ± SEM (n = 10–12 biological replicates for heart and liver; n = 6 for skeletal muscle, one-way ANOVA with Dunnett’s test for multiple comparisons for each tissue). (D) Southern blot analysis of PstI-digested mtDNA derived from heart tissue of wild-type (Con) and BAC-TFAM animals derived from different founders (TG 188, TG 137, and TG 91). mtDNA was quantified by radiolabeling with a specific probe against COX1, nuclear DNA was probed with 18S. A representative image is shown (n = 3 independent experiments). (E) Analysis of steady-state mitochondrial transcript levels in the heart of wild-type (Con) and BAC-TFAM animals derived from different founders (TG 188, TG 137, TG 91) by Northern blotting. Mitochondrial mRNAs and tRNAs were radiolabelled using specific probes, 18S was probed as a loading control. A representative image is shown (n = 3 independent experiments). (F) Quantification of (D). Data are expressed as means ± SEM (n = 3 biological replicates; P < 0.05: *, P < 0.01:**, two-way ANOVA with Sidak’s test for multiple comparisons). Source data are available for this figure.
Figure S2.
Figure S2.. Moderately increased TFAM levels do not affect animal physiology.
(A) Comparison of protein steady-state levels in the heart, liver, and spleen whole cell lysates of wild-type (Con) and bacterial artificial chromosome (BAC)-TFAM (+/BAC) mice as determined by tandem mass tag labelling and LC–MS/MS. (B, C) Phenotyping/energy homeostasis of BAC-TFAM mice. Cohorts of BAC-TFAM mice and age-matched wild-types were analysed by indirect calorimetry at the age of 10 and 52 wk. Daily food (B) and water intake (C) are shown. (D) Body weight of wild-type (Con) and BAC-TFAM (+/BAC) animals at the age of 10 and 52 wk. (E, F) Phenotyping/energy homeostasis of BAC-TFAM mice. Cohorts of BAC-TFAM mice and age-matched wild-types were analysed by indirect calorimetry at the age of 10 and 52 wk. Heat (E) and cumulative distance (F) are shown. (G) Number of pups per litter in the different founder lines (BAC TG 188, TG 137, TG 91). For phenotyping analyses: n = 5–9 biological replicates; P < 0.05: *, two-way ANOVA with Sidak’s test for multiple comparisons. Source data are available for this figure.
Figure 2.
Figure 2.. High TFAM overexpression leads to early postnatal mortality.
(A) Strategy to generate CAG-TFAM mice. A cDNA construct encoding a FLAG-tagged TFAM protein under the control of the CAG promoter was introduced into the ROSA26 locus by homologous recombination. CAG-TFAM mice were generated by crossing to β-actin cre animals. (B) Survival curve of CAG-TFAM mice. Litters yielding CAG-TFAM mice (+/CAG) were observed for 40 d for development and survival compared with control litter mates (Con) (n = 12). (C) Body weight of CAG-TFAM mice (+/CAG) compared with control litter mates (Con) at the age of 3 wk. Means ± SEM, n = 12 biological replicates; P < 0.05:*, unpaired t test. Scale bar, 1 cm. (D) COX/SDH staining of heart (upper panel) and skeletal muscle (lower panel) of CAG-TFAM mice (+/CAG) compared with control litter mates (Con) at the age of 3 wk. Representative images are shown (n = 3 biological replicates). Scale bar, 100 μm. Source data are available for this figure.
Figure S3.
Figure S3.. In vivo effects of strong TFAM overexpression.
(A) Litter size of CAG-TFAM mouse line. (n = 5 (control) or 13 (+/CAG) litters; unpaired t test.) (B) Organ weight of CAG-TFAM hearts and livers (+/CAG) compared with control litter mates (Con) at the age of 3 wk. Means ± SEM, n = 6 biological replicates. P < 0.01: **; P < 0.0001: ****, paired t test. (C) Representative image of the heart, liver, and kidney of CAG-TFAM (+/CAG) mice and control litter mates. Scale bar, 1 cm. (D) Subcellular fractionation and subsequent Western blot analysis of heart and liver samples derived from CAG-TFAM (+/CAG) mice and control litter mates (Con). Potential perturbation of mitochondrial matrix protein import was investigated by assessing the subcellular localization of aconitase (ACO2). Decoration with VDAC (voltage-dependent anion channel, mitochondrial fraction), tubulin (cytosolic fraction), and cytochrome c (Cyt c, intact mitochondrial membranes) were included as controls. Cyto, cytosolic fraction; mito, mitochondrial fraction. A representative image is shown (n = 2 independent experiments). (E) Western blot analysis of mitochondrial precursor proteins in the heart, liver, and skeletal muscle whole tissue lysates of CAG-TFAM (+/CAG) mice. A representative image is shown (n = 2 independent experiments). (F) Peptide coverage in ATP5A and NDUFA9 as assessed by tandem mass tag labelling and LC–MS/MS in the heart, liver, and skeletal muscle whole cell lysates. No peptides corresponding to the mitochondrial targeting sequences were detected. (G) Heat map illustrating the log2 fold-change in protein levels of TCA cycle enzymes (left), lipid and acetyl-CoA metabolism (middle), and iron-sulphur cluster and heme synthesis (right) in the heart, skeletal muscle, and liver of CAG-TFAM mice compared with litter mates. Heat map: minimum (−2), blue; maximum (2), red. Source data are available for this figure.
Figure 3.
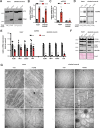
Figure 3.. High TFAM-to-mtDNA ratios abolish mtDNA expression in skeletal muscle.
(A) Western blot analysis of TFAM protein levels in heart and skeletal muscle whole cell lysates of CAG-TFAM (+/CAG) mice. Litter mates were used as controls (Con). Actin was used as a loading control. The asterisk indicates the lower wild-type TFAM band in control mice as opposed to the overexpression of the FLAG-tagged version of TFAM in CAG-TFAM mice. A representative image is shown (n = 2 independent experiments). (B) TFAM protein levels in heart and skeletal muscle whole cell lysates of CAG-TFAM animals (+/CAG) and control litter mates were quantified by densitometry and are expressed as folds of control (means ± SEM, n = 4–5 biological replicates; P < 0.0001: ****, two-way ANOVA with Sidak’s test for multiple comparisons). (C) Quantification of steady-state mtDNA levels in heart and skeletal muscle of CAG-TFAM (+/CAG) animals and control litter mates (Con). mtDNA levels were quantified by qPCR using specific probes against COX1 and 18S. Data are expressed as means ± SEM (n = 6–7 biological replicates for heart; n = 3 for skeletal muscle; n.s., non-significant, P < 0.0001: ****, two-way ANOVA with Sidak’s test for multiple comparisons). (D) Southern blot analysis of PstI-digested mtDNA derived from heart and skeletal muscle of CAG-TFAM (+/CAG) animals and control litter mates (Con). mtDNA was quantified by radiolabeling with a specific probe against COX1, nuclear DNA was probed with 18S. A representative image is shown (n = 3 independent experiments). (E) Analysis of steady-state mitochondrial transcript levels in heart and skeletal muscle of CAG-TFAM (+/CAG) animals and control litter mates (Con) by qRT-PCR. Mitochondrial mRNAs and tRNAs were quantified using specific mouse probes, β-2-microglobulin was used as a reference gene. (n = 5 biological replicates, P < 0.05: *; P < 0.001:***; P < 0.0001: ****, two-way ANOVA with Sidak’s test for multiple comparisons). (F) Western blot analysis of steady-state levels of respiratory chain subunits in heart and skeletal muscle mitochondrial extracts of CAG-TFAM (+/CAG) animals and control litter mates (Con). A representative image is shown (n = 3 independent experiments). (G) Representative images of fixed heart (left) and skeletal muscle (right) tissue from control (con) and CAG-TFAM animals at 16 d of age analysed by transmission electron microscopy. For each genotype, six biological replicates were analysed. Scale bars, heart: 20 (upper panels), 5 (middle), 1 μm (lower panels); skeletal muscle: 10 (upper panel), 2 (middle), and 1 μm (lower panel). Source data are available for this figure.
Figure S4.
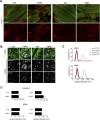
Figure S4.. High TFAM overexpression leads to nucleoid clustering.
(A) Representative confocal images of mtDNA from heart sections of CAG-TFAM, bacterial artificial chromosome-TFAM animals, and their controls. Mitochondria are labelled with a TOM20 antibody (green). Scale bar: 5 μm. (B) 2D images of mitochondrial nucleoids (mtDNA) from (A), obtained by dual confocal and gated STED (gSTED) microscopy. Merge between mitochondria (TOM20, green) and mtDNA is shown in the upper panel. Scale bar: 1.5 μm. (C) Gaussian distribution of nucleoid diameters from (B), as determined by confocal (dashed line) and gSTED (full line) microscopy. (D) Average diameters of nucleoids from confocal (top graph) and STED-acquired (bottom graph) images in bacterial artificial chromosome-TFAM and CAG-TFAM hearts. For each genotype (n = 3 biological replicates) up to 386 nucleoids were analysed. Mann–Whitney test, ***P < 0.001.
Figure 4.
Figure 4.. Tissue-specific responses to high TFAM levels.
(A, B, C, D) Heat map illustrating the log2 fold-change in protein levels of OXPHOS subunits (A), mitoribosomal subunits (B), components of the mtDNA expression machinery (C), and ATP-dependent mitochondrial proteases (D) in the heart, skeletal muscle, and liver of CAG-TFAM mice compared to litter mates. Heat map: minimum (−2), blue; maximum (2), red.
Figure S5.
Figure S5.. Tissue-specific responses to high TFAM levels.
(A) Comparison of protein steady-state levels in whole cell proteome of CAG-TFAM mice determined by tandem mass tag labelling and LC–MS/MS. (B) Detection of TFAM phosphorylation in skeletal muscle by Phostag-Page. Whole cell lysates of control mice (Con), CAG-TFAM skeletal muscle (+/CAG) and CAG samples treated with lambda phosphatase (λ) were either run on regular 10% NuPage gels or Phostag gels (Bis-Tris, 10%, 50 μM Phostag). As a control, recombinant mouse TFAM was treated with PKA and PKA and lambda phosphatase and run in parallel on the gel. (C) Detection of TFAM phosphorylation in liver by Phos-tag-Page. Whole cell lysates of control mice (Con), CAG-TFAM liver (+/CAG) and CAG samples treated with lambda phosphatase were either run on regular 10% NuPage gels or PhosTag gels (Bis-Tris, 10%, 50 μM PhosTag). Source data are available for this figure.
Figure 5.
Figure 5.. mtDNA expression is maintained despite high TFAM levels in liver.
(A) Western blot analysis of TFAM protein levels in liver whole cell lysates of CAG-TFAM (+/CAG) mice. Litter mates were used as controls (Con). Actin was used as a loading control. A representative image is shown (n = 2 independent experiments). (B) TFAM protein levels in control and CAG-TFAM animals were quantified by densitometry and are expressed as folds of control (means ± SEM, n = 4–5 biological replicates; P < 0.05: *, two-way ANOVA with Sidak’s test for multiple comparisons). (C) Quantification of steady-state mtDNA levels in liver tissue of CAG-TFAM (+/CAG) animals and control litter mates (Con). mtDNA levels were quantified by qPCR using specific probes against COX1 and 18S. Data are expressed as means ± SEM (n = 6–7 biological replicates). (D) Southern blot analysis of PstI-digested mtDNA derived from heart and skeletal muscle of CAG-TFAM (+/CAG) animals and control litter mates (Con). mtDNA was quantified by radiolabeling with a specific probe against COX1, nuclear DNA was probed with 18S. A representative image is shown (n = 3 independent experiments). (E) Analysis of steady-state mitochondrial transcript levels in liver tissue of CAG-TFAM (+/CAG) animals and control litter mates (Con) by qRT-PCR. Data are expressed as means ± SEM (n = 5 biological replicates). (F) De novo RNA synthesis in skeletal muscle and liver mitochondria isolated from CAG-TFAM (+/CAG) mice and control litter mates. Mitochondria were pulse labelled for 1 h. Mitochondrial HSP60 was used as a loading control. A representative image is shown (n = 2–3 independent experiments). (G) Representative images of fixed liver tissue from control (Con) and CAG-TFAM animals at 16 d of age analysed by transmission electron microscopy. For each genotype, six biological replicates were analysed. Scale bars, 20 (upper panels), 5 (middle), 2 μm (lower panels). (H) Measurement of triglyceride content. Approximately 100 mg of liver tissue was homogenized and triglycerides were quantified using the triglycerides quantification kit (Sigma-Aldrich). Data are expressed as means ± SEM (n = 5 biological replicates; P < 0.001:***, unpaired t test). Source data are available for this figure.
Figure 6.
Figure 6.. Regulation of mtDNA expression by TFAM levels in vivo.
An overview of the proposed regulation of mtDNA expression by TFAM-induced compaction of mitochondrial nucleoids. Open and compacted mitochondrial nucleoids are schematically depicted as circles. The other icons are explained in the figure. This figure was generated using Biorender.com (PDB entries: 3SPA, 7KSM, 2DUD, 6ERP, 3TMM) (Ngo et al, 2011; Ringel et al, 2011; Hillen et al, 2017).

References

    1. Alam TI, Kanki T, Muta T, Ukaji K, Abe Y, Nakayama H, Takio K, Hamasaki N, Kang D (2003) Human mitochondrial DNA is packaged with tfam. Nucleic Acids Res 31: 1640–1645. 10.1093/nar/gkg251 - DOI - PMC - PubMed
    1. Anderson S, Bankier AT, Barrell BG, de Bruijn MH, Coulson AR, Drouin J, Eperon IC, Nierlich DP, Roe BA, Sanger F, et al. (1981) Sequence and organization of the human mitochondrial genome. Nature 290: 457–465. 10.1038/290457a0 - DOI - PubMed
    1. Bibb MJ, Van Etten RA, Wright CT, Walberg MW, Clayton DA (1981) Sequence and gene organization of mouse mitochondrial DNA. Cell 26: 167–180. 10.1016/0092-8674(81)90300-7 - DOI - PubMed
    1. Bonekamp NA, Larsson NG (2018) Snapshot: Mitochondrial nucleoid. Cell 172: 388–388.e1. 10.1016/j.cell.2017.12.039 - DOI - PubMed
    1. Boos F, Krämer L, Groh C, Jung F, Haberkant P, Stein F, Wollweber F, Gackstatter A, Zöller E, van der Laan M, et al. (2019) Mitochondrial protein-induced stress triggers a global adaptive transcriptional programme. Nat Cell Biol 21: 442–451. 10.1038/s41556-019-0294-5 - DOI - PubMed

Publication types

MeSH terms

LinkOut - more resources