Comment
. 2016 Jun 17;291(25):13098-112.
doi: 10.1074/jbc.M116.720557. Epub 2016 Apr 19.

Major Variations in HIV-1 Capsid Assembly Morphologies Involve Minor Variations in Molecular Structures of Structurally Ordered Protein Segments

Affiliations
Comment

Major Variations in HIV-1 Capsid Assembly Morphologies Involve Minor Variations in Molecular Structures of Structurally Ordered Protein Segments

Jun-Xia Lu et al. J Biol Chem. .

Abstract

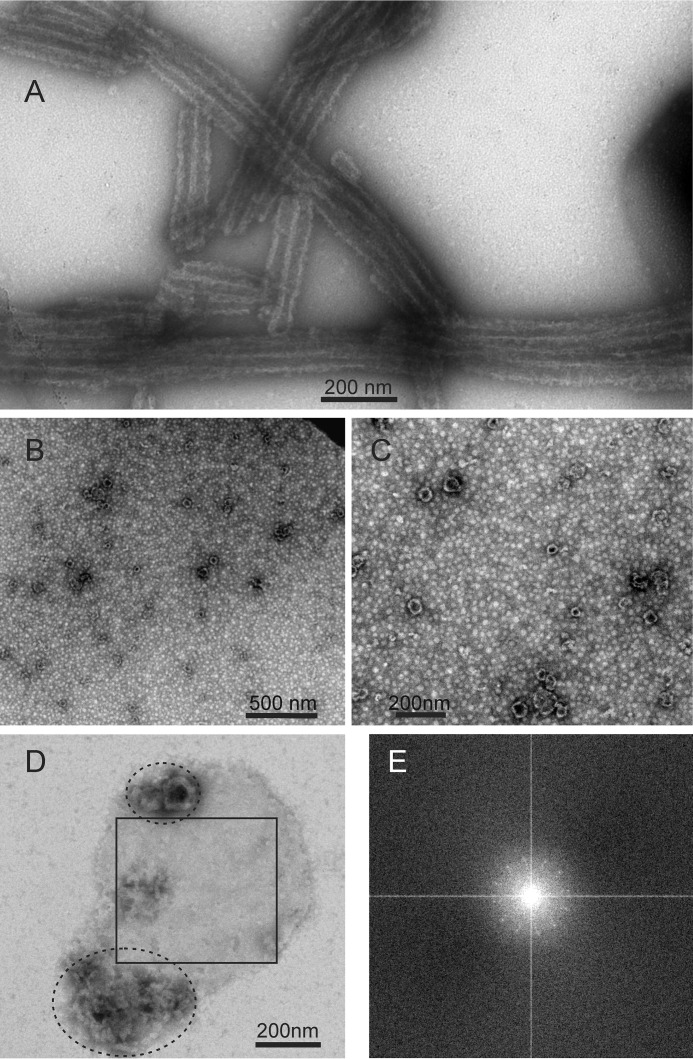
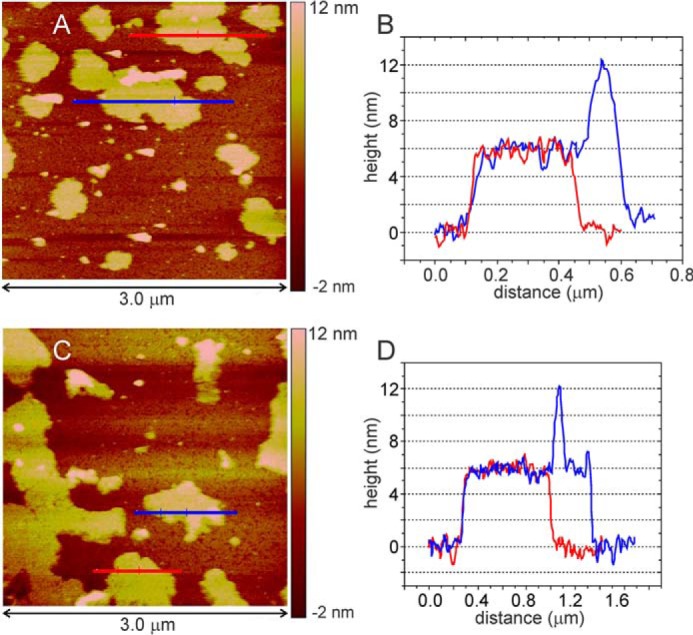
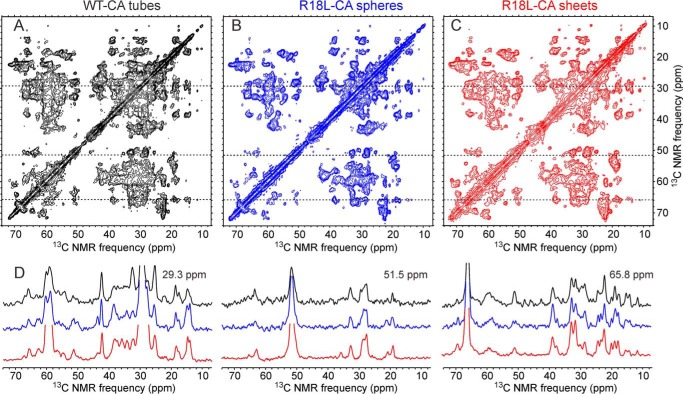
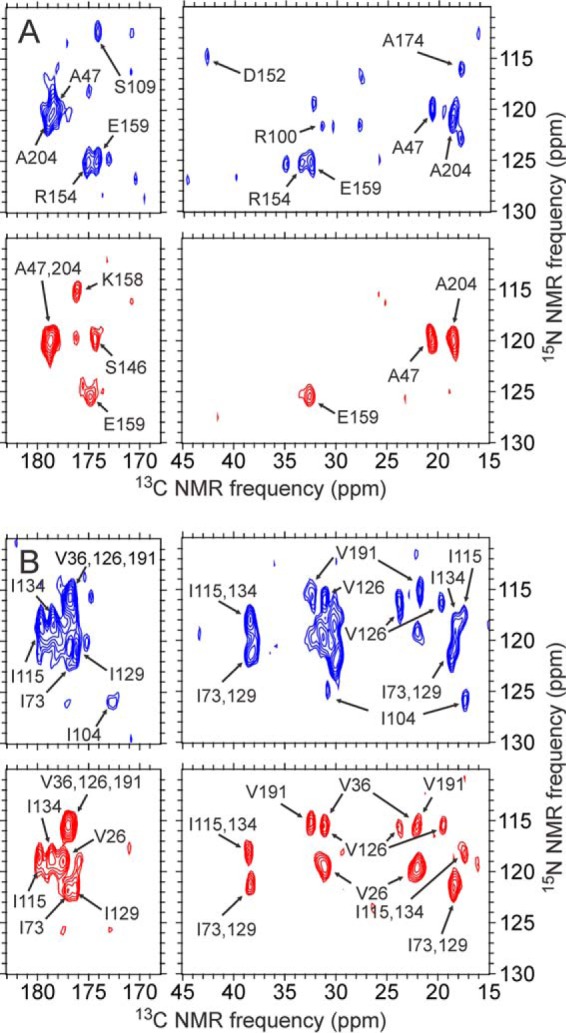
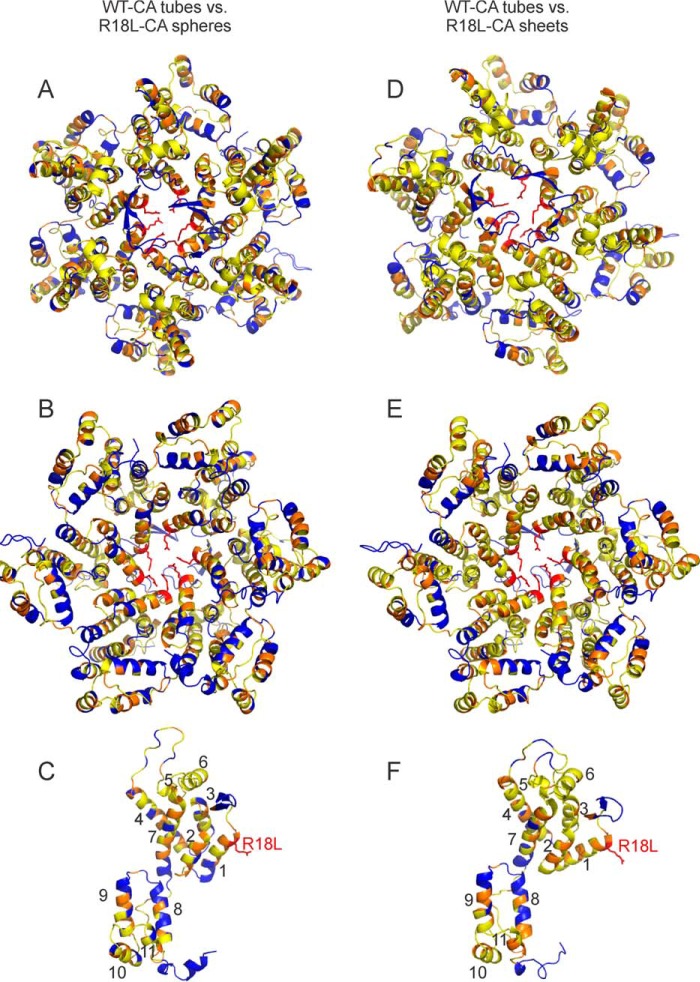
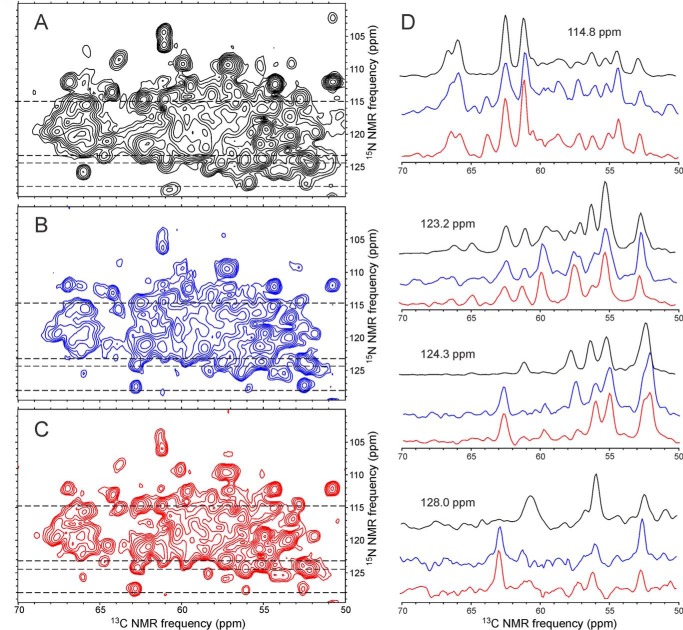
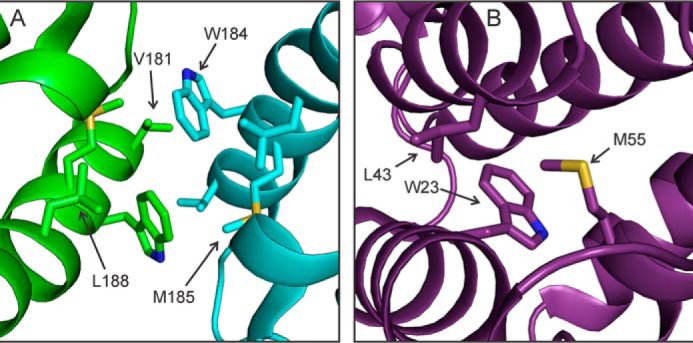
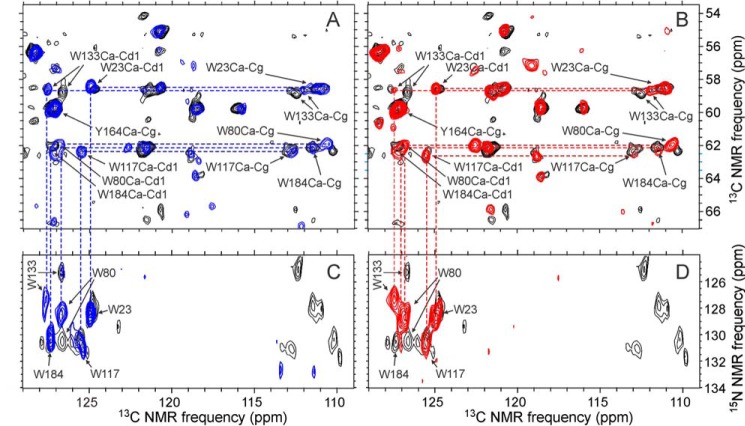
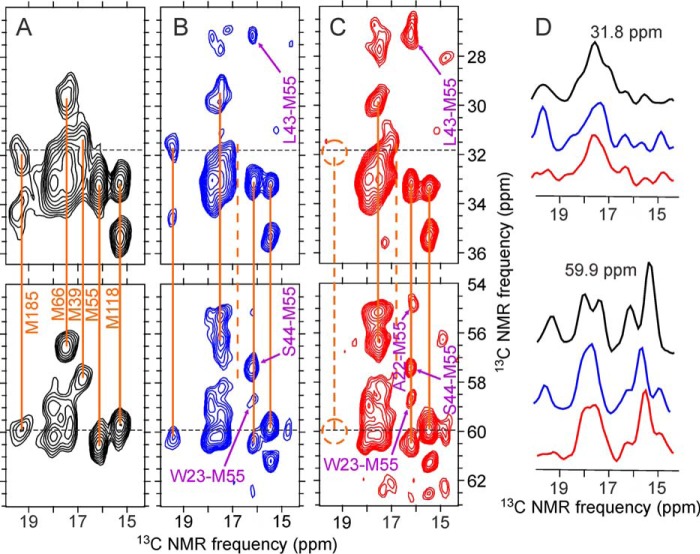
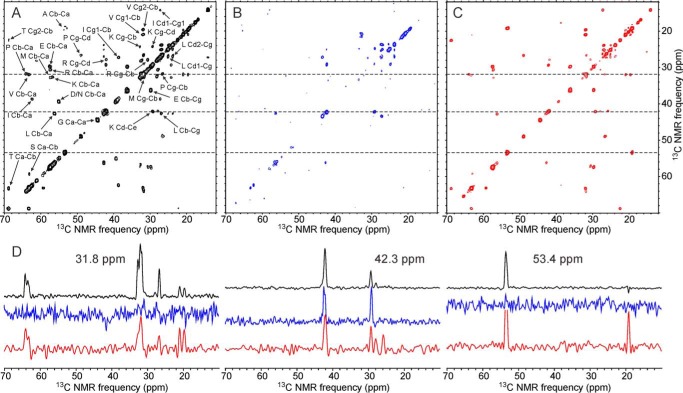
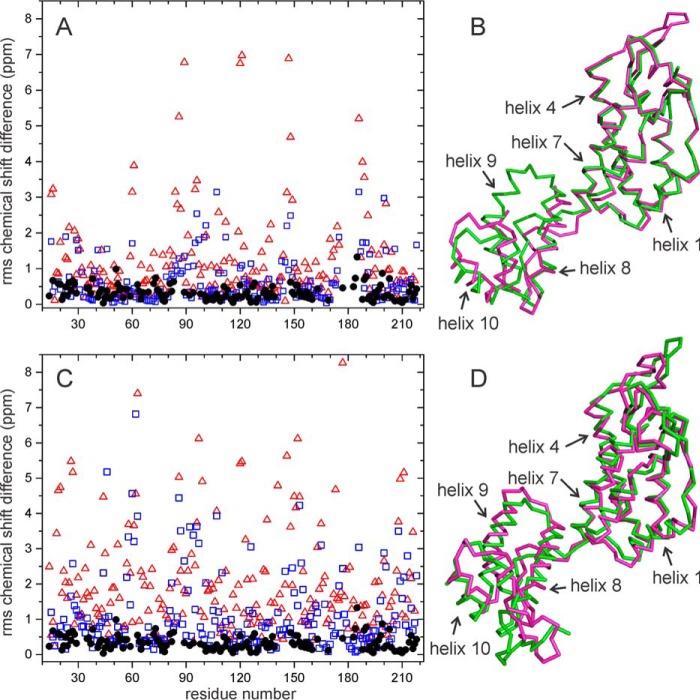
We present the results of solid state nuclear magnetic resonance (NMR) experiments on HIV-1 capsid protein (CA) assemblies with three different morphologies, namely wild-type CA (WT-CA) tubes with 35-60 nm diameters, planar sheets formed by the Arg(18)-Leu mutant (R18L-CA), and R18L-CA spheres with 20-100 nm diameters. The experiments are intended to elucidate molecular structural variations that underlie these variations in CA assembly morphology. We find that multidimensional solid state NMR spectra of (15)N,(13)C-labeled CA assemblies are remarkably similar for the three morphologies, with only small differences in (15)N and (13)C chemical shifts, no significant differences in NMR line widths, and few differences in the number of detectable NMR cross-peaks. Thus, the pronounced differences in morphology do not involve major differences in the conformations and identities of structurally ordered protein segments. Instead, morphological variations are attributable to variations in conformational distributions within disordered segments, which do not contribute to the solid state NMR spectra. Variations in solid state NMR signals from certain amino acid side chains are also observed, suggesting differences in the intermolecular dimerization interface between curved and planar CA lattices, as well as possible differences in intramolecular helix-helix packing.

Keywords: human immunodeficiency virus (HIV); molecular dynamics; protein assembly; protein structure; solid state NMR.


Figures

FIGURE 1.
FIGURE 1.
TEM images of negatively stained HIV-1 capsid protein assemblies. A, WT-CA tubes. B and C, R18L-CA spheres. D, planar R18L-CA sheet. Non-planar material within ellipses may result from disruption or dissolution of R18L-CA sheets during the TEM grid preparation process. E, Fourier transform of the region of panel D enclosed by a square. The pattern of spots with 6-fold symmetry indicates two-dimensional crystallinity of R18L-CA sheets.
FIGURE 2.
FIGURE 2.
A and C, AFM images of R18L-CA sheets. Images were recorded in tapping mode on mica substrates, immersed in assembly buffer within the fluid cell of the AFM instrument. B and D, height profiles along blue and red lines in panels A and C, showing the uniform 6-nm thickness of single R18L-CA sheets. Features with 12 nm height are attributable to double layers.
FIGURE 3.
FIGURE 3.
Two-dimensional 13C-13C solid state NMR spectra of uniformly 15N,13C-labeled HIV-1 capsid protein assemblies. A, U-WT-CA tubes. B, U-R18L-CA spheres. C, U-R18L-CA sheets. D, one-dimensional slices at 29.3, 51.5, and 65.8 ppm (dashed lines in two-dimensional spectra). The one-dimensional slices are color-coded to match the two-dimensional spectra. DARR mixing periods between t1 and t2 periods were 100 ms for U-WT-CA tubes and 25 ms for U-R18L-CA spheres and sheets. Maximum t1 periods were 5.0–8.9 ms. Total measurement times were ∼18 h. Contour levels increase by factors of 1.5.
FIGURE 4.
FIGURE 4.
Examples of two-dimensional slices from three-dimensional NCACX spectra of uniformly 15N,13C-labeled R18L-CA spheres (blue) and sheets (red). A, slices at 53.4 ppm in the t2 dimension (i.e. CA dimension). B, slices at 65.5 ppm in the t2 dimension. Cross-peak assignments are based on analyses of two- and three-dimensional spectra and on previously reported assignments for WT-CA tubes (15). Spectra were recorded with 20 ms DARR mixing periods between t2 and t3 periods. Maximum t1 and t2 periods were 5.2–5.9 and 6.0–6.7 ms, respectively. Total measurement times were ∼12 days. Contour levels increase by factors of 1.2.
FIGURE 5.
FIGURE 5.
Summary of differences in solid state NMR chemical shifts between R18L-CA assemblies and WT-CA tubes. Residue-specific values of chemical shift differences Δrms (defined in the main text) are represented by colors on a schematic representation of a CA hexamer (A, B, D, and E) or monomer (C and F). Hexamer and monomer structures come from PDB file 3J34. Chemical shifts of R18L-CA spheres and WT-CA tubes are compared in panels A–C. Chemical shifts of R18L-CA sheets and WT-CA tubes are compared in panels D–F. Yellow and orange residues have 0.0 ppm < Δrms < 0.4 ppm and Δrms ≥ 0.4 ppm, respectively. Blue residues do not have assigned chemical shifts. The hexamer is viewed from “above” in panels A and D, and “below” in panels B and E. Helical segments are numbered in panels C and F, and the R18L mutation site is shown.
FIGURE 6.
FIGURE 6.
Two-dimensional NCACX spectra of HIV-1 capsid protein assemblies that are uniformly 15N-labeled and partially 13C-labeled. A, 2-Glyc-WT-CA tubes. B, 2-Glyc,Met-R18L-CA spheres. C, 2-Glyc,Met-R18L-CA sheets. D, color-coded one-dimensional slices at 15N chemical shifts of 114.8, 123.2, 124.3, and 128.0 ppm (dashed lines in two-dimensional spectra). DARR mixing periods between t1 and t2 periods were 25 ms. Maximum t1 periods were 7.2 ms. Total measurement times were ∼48 h. Contour levels increase by factors of 1.5.
FIGURE 7.
FIGURE 7.
Intermolecular and intramolecular side chain-side chains interactions in HIV-1 capsid protein assemblies. A, intermolecular dimerization interface, involving helix 9 segments of interacting CTD domains from different CA molecules (green and cyan) around local 2-fold symmetry axes. B, intramolecular contacts of helices 1, 2, and 3 within a single NTD domain (purple). Structures in panels A and B are present in crystalline WT-CA (PDB file 4XFX), and may be somewhat different in WT-CA tubes, R18L-CA spheres, and R18L-CA sheets.
FIGURE 8.
FIGURE 8.
Aromatic regions of two-dimensional 13C-13C and two-dimensional 15N-13C spectra of HIV-1 capsid protein assemblies that are uniformly 15N labeled and partially 13C labeled. A and C, two-dimensional spectra of R18L-CA spheres (blue), overlaid on two-dimensional spectra of WT-CA tubes (black). Assignments of cross-peaks from tryptophan residues and one tyrosine residue are shown. B and D, two-dimensional spectra of R18L-CA sheets (red), overlaid on two-dimensional spectra of WT-CA tubes (black). Spectra in panels A and B were obtained with U-R18L-CA and U-WT-CA. Spectra in panels C and D were obtained with 2-Glyc,Met-R18L-CA and 2-Glyc-WT-CA. DARR mixing periods were 500 ms in two-dimensional 13C-13C spectra and 140 ms in two-dimensional 15N-13C spectra. Maximum t1 periods were 6.9 ms in two-dimensional 13C-13C spectra and 6.4 ms in two-dimensional 15N-13C spectra. The 13C carrier frequency during 15N-13C cross-polarization was set to 127 ppm in the two-dimensional 15N-13C spectrum of 2-Glyc-WT-CA tubes and 174 ppm in two-dimensional 15N-13C spectra of 2-Glyc,Met-R18L-CA assemblies, accounting for differences in signals below 115 ppm in these spectra. Contour levels increase by factors of 1.2.
FIGURE 9.
FIGURE 9.
Selected regions of two-dimensional 13C-13C spectra of HIV-1 capsid protein assemblies in which methionine residues are uniformly 15N,13C labeled. A, Met-WT-CA tubes. B, 2-Glyc,Met-R18L-CA spheres. C, 2-Glyc,Met-R18L-CA sheets. Orange lines indicate intra-residue correlations to methionine methyl signals. The dashed line in panel C indicates the absence of signals from Met185. Inter-residue cross-peaks in two-dimensional spectra of 2-Glyc,Met-R18L-CA assemblies, which were also partially 13C labeled at non-methionine residues by expression with [2-13C]glycerol as the carbon source, are indicated by purple labels and arrows. D, color-coded one-dimensional slices at 31.8 and 59.9 ppm (dashed lines in two-dimensional spectra). Spectra were recorded with 500-ms DARR mixing periods and maximum t1 periods of 6.9 ms. Contour levels increase by factors of 1.2.
FIGURE 10.
FIGURE 10.
Two-dimensional 13C-13C INEPT-TOBSY spectra of uniformly 15N,13C-labeled HIV-1 capsid assemblies, showing signals from protein segments that remain highly dynamic in the assemblies. Two-dimensional spectra are shown for U-WT-CA tubes (A), U-R18L-CA spheres (B), and U-R18L-CA sheets (C), with color-coded one-dimensional slices (D) at 3.18, 42.3, and 53.4 ppm, corresponding to the dashed lines in the two-dimensional spectra. Residue-type assignments, based on random-coil chemical shifts, are shown in panel A. Maximum t1 periods were 7.2–8.9 ms. Total measurement times were ∼24 h. Contour levels increase by factors of 1.4.
FIGURE 11.
FIGURE 11.
Predicted chemical shift differences between HIV-1 CA structural models. A, values of Δrms between engineered hexameric (PDB code 3MGE) and pentameric (PDB code 3P05) CA mutants, based on 15N and 13C chemical shift predictions from SHIFTS (red triangles) and ShiftX (blue squares). For comparison, experimental values of Δrms between CA tubes and R18L-CA sheets are shown as solid black circles. B, superposition of Cα traces for the hexameric (magenta) and pentameric (green) CA mutants, for which the r.m.s. deviation between Cα coordinates in residues 10–140 and 150–200 is 1.72 Å. C, values of Δrms between CA chains m and A from a cryo-EM-based model for CA tubes (PDB 3J34), based on chemical shift predication from SHIFTS (red triangles) and ShiftX (blue squares). D, superposition of Cα traces for chains A (magenta) and m (green), for which the r.m.s. deviation between Cα coordinates in residues 10–140 and 150–200 is 2.53 Å.

Comment on

References

    1. Ganser-Pornillos B. K., Yeager M., and Pornillos O. (2012) Assembly and architecture of HIV. Adv. Exp. Med. Biol. 726, 441–465 - PMC - PubMed
    1. Ganser-Pornillos B. K., Cheng A., and Yeager M. (2007) Structure of full-length HIV-1 CA: a model for the mature capsid lattice. Cell 131, 70–79 - PubMed
    1. Li S., Hill C. P., Sundquist W. I., and Finch J. T. (2000) Image reconstructions of helical assemblies of the HIV-1 CA protein. Nature 407, 409–413 - PubMed
    1. Zhao G., Perilla J. R., Yufenyuy E. L., Meng X., Chen B., Ning J., Ahn J., Gronenborn A. M., Schulten K., Aiken C., and Zhang P. (2013) Mature HIV-1 capsid structure by cryo-electron microscopy and all-atom molecular dynamics. Nature 497, 643–646 - PMC - PubMed
    1. Gres A. T., Kirby K. A., KewalRamani V. N., Tanner J. J., Pornillos O., and Sarafianos S. G. (2015) X-ray crystal structures of native HIV-1 capsid protein reveal conformational variability. Science 349, 99–103 - PMC - PubMed

Publication types

Substances

LinkOut - more resources