. 2009 May 6;28(9):1341-50.
doi: 10.1038/emboj.2009.80. Epub 2009 Mar 26.

The structure of Atg4B-LC3 complex reveals the mechanism of LC3 processing and delipidation during autophagy

Affiliations

The structure of Atg4B-LC3 complex reveals the mechanism of LC3 processing and delipidation during autophagy

Kenji Satoo et al. EMBO J. .

Abstract

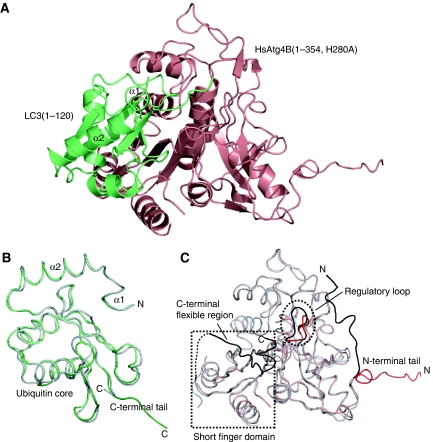
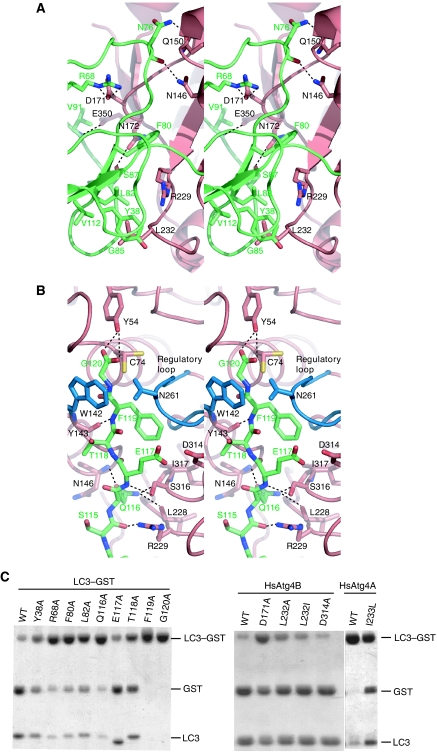
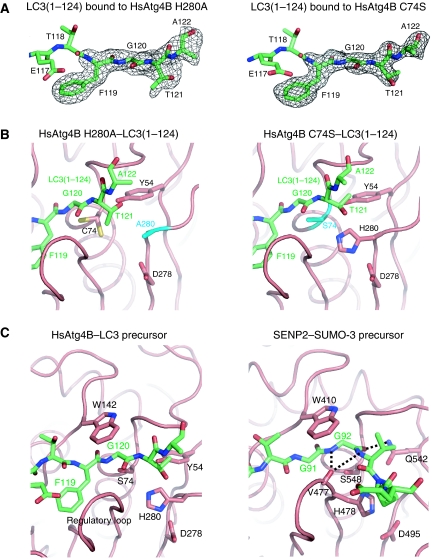
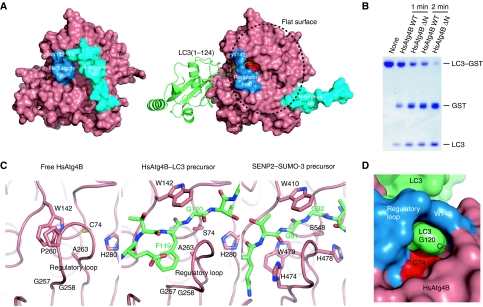
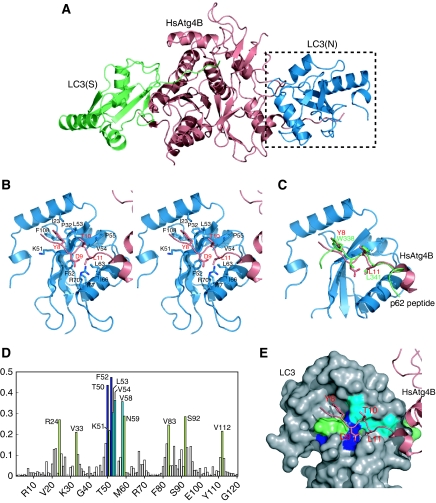
Atg8 is conjugated to phosphatidylethanolamine (PE) by ubiquitin-like conjugation reactions. Atg8 has at least two functions in autophagy: membrane biogenesis and target recognition. Regulation of PE conjugation and deconjugation of Atg8 is crucial for these functions in which Atg4 has a critical function by both processing Atg8 precursors and deconjugating Atg8-PE. Here, we report the crystal structures of catalytically inert human Atg4B (HsAtg4B) in complex with processed and unprocessed forms of LC3, a mammalian orthologue of yeast Atg8. On LC3 binding, the regulatory loop and the N-terminal tail of HsAtg4B undergo large conformational changes. The regulatory loop masking the entrance of the active site of free HsAtg4B is lifted by LC3 Phe119, so that a groove is formed along which the LC3 tail enters the active site. At the same time, the N-terminal tail masking the exit of the active site of HsAtg4B in the free form is detached from the enzyme core and a large flat surface is exposed, which might enable the enzyme to access the membrane-bound LC3-PE.


Figures

Figure 1
Figure 1
Overall structure of the HsAtg4B–LC3 complex. (A) Ribbon diagram of the HsAtg4B–LC3(1–120) complex. HsAtg4B is coloured salmon red, and LC3 is coloured green. (B) Structural comparison between free and HsAtg4B-bound LC3. Crystal structure of free LC3(1–120) (PDB code 1UGM) is superimposed on the HsAtg4B-bound LC3. HsAtg4B-bound LC3 is coloured green, and free LC3 is coloured grey. (C) Structural comparison between free and LC3-bound HsAtg4B. Crystal structure of free HsAtg4B (PDB code 2CY7) is superimposed on the LC3-bound HsAtg4B. LC3-bound HsAtg4B is coloured salmon red, and free HsAtg4B is coloured grey. The regions with large conformational differences between free and LC3-bound forms are coloured black (free) and red (LC3 bound). All the figures representing molecular structures were generated with PyMOL (DeLano, 2002).
Figure 2
Figure 2
Interaction between HsAtg4B and LC3. (A) Interaction between HsAtg4B and the ubiquitin core of LC3. HsAtg4B is coloured salmon red, and LC3 is coloured green. The side chains of the residues involved in the HsAtg4B–LC3 interaction are shown as stick models. Possible hydrophilic interactions are shown as broken lines. (B) Interaction between HsAtg4B and the C-terminal tail of LC3. Trp142 and the regulatory loop of HsAtg4B are coloured blue, whereas the remainder is coloured as in (A). As the side chain of Cys74 has two conformations, both conformations are shown. Possible hydrophilic interactions are shown as broken lines. (C) In vitro proteolysis assay. Left, LC3 mutants fused to GST were incubated with HsAtg4B. Right, LC3–GST was incubated with HsAtg4B mutants. Procedures are described in detail in Materials and methods.
Figure 3
Figure 3
Structure of HsAtg4B complexed with a LC3 precursor. (A) Annealed FoFc electron density map for the C-terminal region (residues 119–122) of LC3(1–124). Left, LC3(1–124) bound to the HsAtg4B H280A mutant; right, LC3(1–124) bound to the HsAtg4B C74S mutant. Structure of the C-terminal region of LC3 is also shown as a stick model, in which carbon, nitrogen and oxygen atoms are coloured green, blue and red, respectively. (B) Structure of the C-terminal tail of LC3(1–124) and the catalytic site of HsAtg4B. Left, LC3(1–124) bound to HsAtg4B H280A mutant, right, LC3(1–124) bound to the HsAtg4B C74S mutant. HsAtg4B is shown as a ribbon model, whereas LC3 is shown as a stick model. The side chains of the residues comprising the catalytic triad and Tyr54 of HsAtg4B are also shown as a stick model. Carbon, nitrogen, oxygen and sulphur atoms are coloured green, blue, red and yellow, respectively. Mutated catalytic residues are coloured cyan. (C) Structural comparison between the HsAtg4B–LC3 precursor and SENP2–SUMO-3 precursor complexes. Left, structure of the HsAtg4B–LC3 precursor complex; right, structure of the SENP2–SUMO-3 precursor complex. HsAtg4B and SENP2 are shown as a ribbon model, whereas LC3 and SUMO-3 precursors are shown as a stick model. The side chains of the important residues at the catalytic site are also shown as a stick model. Atom colouring is the same as in (A, B).
Figure 4
Figure 4
Conformational change in HsAtg4B upon complex formation with LC3. (A) Surface model of free (left) and LC3(1–124)-bound (right) HsAtg4B. W142 and the regulatory loop are coloured blue, and the N-terminal tail is coloured cyan. The catalytic Cys74 is coloured red. LC3(1–124) is shown as a ribbon model. (B) In vitro proteolysis assay using N-terminal tail-deleted HsAtg4B. LC3–GST was incubated with either wild-type or N-terminally truncated HsAtg4B and was subjected to SDS–PAGE analysis. (C) Structural comparison between free and LC3(1–124)-bound HsAtg4B and SENP2–SUMO-3 precursor complexes. Left, free HsAtg4B; middle, the HsAtg4B–LC3 precursor complex; right, the SENP2–SUMO-3 precursor complex. The three structures are shown in the same orientation. Model colouring is the same as in Figure 3. (D) Surface model of LC3(1–120) bound to HsAtg4B. Atom colouring is the same as in (A).
Figure 5
Figure 5
Interaction of the N-terminal tail with the WXXL-binding site of LC3. (A) Overall structure of HsAtg4B bound to both substrate and non-substrate LC3. Substrate LC3 is designated as LC3(S) and coloured green, whereas non-substrate LC3 is designated as LC3(N) and coloured blue. (B) Stereo-view of the N-terminal tail of HsAtg4B bound to the WXXL-binding site of LC3. The side chains of the residues involved in the interaction between HsAtg4B and LC3 are labelled and shown with a stick model. Model colouring is the same as in (A). (C) Structural comparison of the N-terminal tail–LC3 interaction with the p62–LC3 interaction. The structure of LC3 complexed with a p62 peptide is superimposed on that complexed with the N-terminal tail peptide. As the structure of LC3 is almost identical to each other, only that bound to the N-terminal tail peptide of HsAtg4B is shown. (D) Chemical shift perturbations of the LC3 backbone amide groups upon complex formation with the N-terminal-tail peptide. The combined 1H and 15N chemical shift differences, calculated using the equation Δp.p.m.=[(ΔδHN)2+(ΔδN/5)2]1/2 were plotted against residue numbers. (E) Mapping of chemical shift perturbation results on the crystal structure of LC3 bound to HsAtg4B. The residues with Δp.p.m. >0.4 are shown in blue, 0.4>Δp.p.m.>0.3 in cyan and 0.3>Δp.p.m. >0.2 in green.

References

    1. Baba M, Takeshige K, Baba N, Ohsumi Y (1994) Ultrastructural analysis of the autophagic process in yeast: detection of autophagosomes and their characterization. J Cell Biol 124: 903–913 - PMC - PubMed
    1. Brunger AT, Adams PD, Clore GM, DeLano WL, Gros P, Grosse-Kunstleve RW, Jiang JS, Kuszewski J, Nilges M, Pannu NS, Read RJ, Rice LM, Simonson T, Warren GL (1998) Crystallography & NMR system: a new software suite for macromolecular structure determination. Acta Crystallogr D Biol Crystallogr 54(Part 5): 905–921 - PubMed
    1. Delaglio F, Grzesiek S, Vuister G, Zhu W, Pfeifer J, Bax A (1995) NMRPipe: a multidimensional spectral processing system based on UNIX pipes. J Biomol NMR 6: 277–293 - PubMed
    1. DeLano WL (2002) The PyMOL Molecular Graphics System. Palo Alto, CA: DeLano Scientific LLC
    1. Emsley P, Cowtan K (2004) Coot: model-building tools for molecular graphics. Acta Crystallogr D Biol Crystallogr 60(Part 12, Part 1): 2126–2132 - PubMed

Publication types

MeSH terms

Substances