. 2009 Jan;16(1):35-41.
doi: 10.1038/nsmb.1537. Epub 2008 Dec 21.

Structural analysis of ion selectivity in the NaK channel

Affiliations

Structural analysis of ion selectivity in the NaK channel

Amer Alam et al. Nat Struct Mol Biol. 2009 Jan.

Abstract

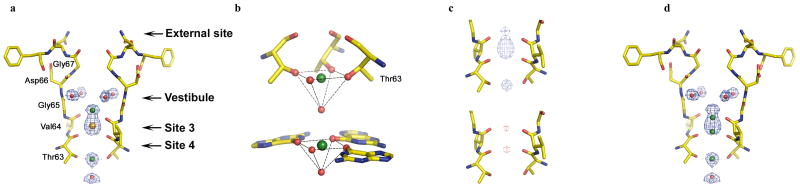
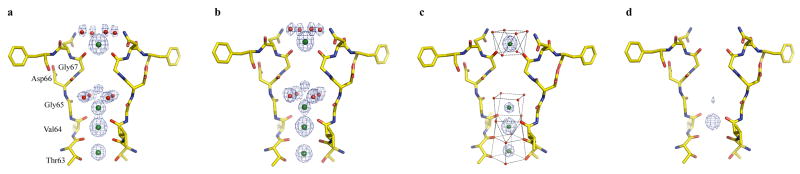
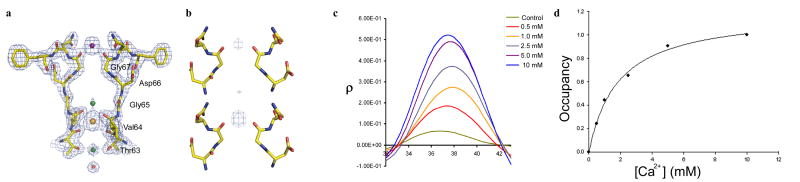
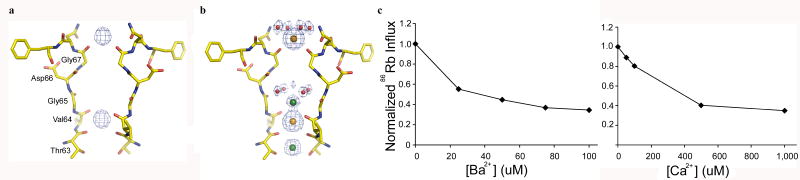
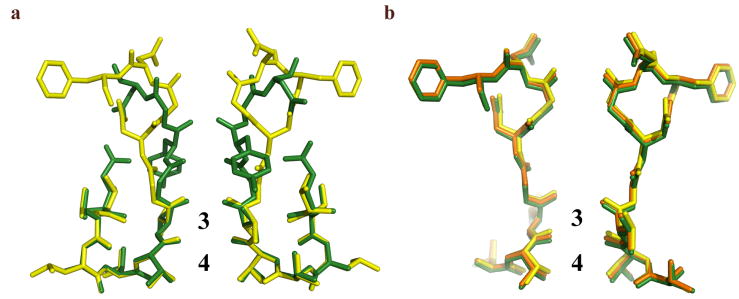
Here we present a detailed characterization of ion binding in the NaK pore using the high-resolution structures of NaK in complex with various cations. These structures reveal four ion binding sites with similar chemical environments but vastly different ion preference. The most nonselective of all is site 3, which is formed exclusively by backbone carbonyl oxygen atoms and resides deep within the selectivity filter. Additionally, four water molecules in combination with four backbone carbonyl oxygen atoms are seen to participate in K(+) and Rb(+) ion chelation, at both the external entrance and the vestibule of the NaK filter, confirming the channel's preference for an octahedral ligand configuration for K(+) and Rb(+) binding. In contrast, Na(+) binding in the NaK filter, particularly at site 4, utilizes a pyramidal ligand configuration that requires the participation of a water molecule in the cavity. Therefore, the ability of the NaK filter to bind both Na(+) and K(+) ions seemingly arises from the ions' ability to use the existing environment in unique ways, rather than from any structural rearrangements of the filter itself.


Conflict of interest statement

Competing interests statement: The authors declared no competing interests.

Figures

1
1
Na+ binding in the NaK filter (a) 2Fo-Fc ion omit map contoured at 1.5σ showing density (blue mesh) for Na+ ions, water molecules in the vestibule and central cavity, and the contaminating ion at site 3 (green, red, and orange spheres, respectively). The front and back subunits of the NaK model have been removed for clarity in most figures. (b) Comparison of Na+ binding in NaK at site 4 (upper) and the 3′ side of the guanine tetraplex (lower) showing Na+ binding in plane with 4 of its ligand, with a water molecule sitting axial to it. (c) 2Fo-Fc ion omit map contoured at 2.5σ (blue mesh, upper) showing football shape of electron density at site 3 of NaKNΔ19 in high Na+ (500mM); and the Fo-Fc map with Cs+ at site 3 contoured at 4 σ (red mesh, lower) showing density that likely arises from a contribution of Na+ present on both the upper and lower edges of site 3. (d) Suggested mode of Na+ binding at the upper and lower edges of site 3.
2
2
K+ and Rb+ binding in the NaK selectivity filter. The 2Fo-Fc ion omit maps (1.5σ) show electron density of ion binding in the K+ complex (a) and Rb+ complex (b) of NaKNΔ19. K+ and Rb+ ions are colored green with water molecules represented as red spheres. c) The maintenance of an octahedral ligand arrangement in the K+ complex, which also holds true for the Rb+ complex. Oxygen atoms from the front and back subunits chelating the ions are shown as red spheres. d) FCs soak − FK difference map contoured at 10 σ showing Cs+ binding at site 3.
3
3
Ca2+ binding in the NaK selectivity filter. (a) 2Fo-Fc ion omit map (1.5σ) of the NaKNΔ19-Na+ complex co-crystallized with 10mM CaCl2, showing electron density for a Ca2+ ion (purple sphere) at the external entrance. Na+ and the contaminant at site 3 are modeled as green and orange spheres, respectively. Electron density for the protein backbone is also shown as a blue mesh. (b) F0.5mM Ca − F0mM Ca (upper) and F5mM Ca2+ − F0mM Ca2+ (lower) difference map contoured at 10 σ showing increasing intensity of Ca2+ binding upon increasing Ca2+ concentration. Dotted lines indicate the position of central axis along which the 1-D electron density was calculated. (c) 1-D electron density profile of Ca2+ binding at the external entrance showing increased Ca2+ binding at increasing concentrations. The control is from a difference map between two native crystals grown in the absence of Ca2+. (d) Occupancy of Ca2+ binding at the external site was calculated by integration of the peaks in 1-D electron density profile and normalizing them against the 10 mM Ca2+ peak. The plot of occupancy against Ca2+ concentration give rise to a Kd value of about 1.8 mM upon fitting the curve to a single component Langmuir equation.
4
4
Ba2+ binding in NaK filter. a) FBa soak − FK difference map (blue mesh) contoured at 10 σ showing the two Ba2+ binding sites. (b) 2Fo-Fc ion omit maps of Ba2+-soaked crystal contoured at 1.5 σ. The electron density at external entrance and site 3 was modeled as Ba2+ (orange spheres) and water molecules are modeled as red spheres. (c) Ba2+ (left) and Ca2+ (right) blocking of 86Rb influx in liposomes loaded with NaCl.
5
5
Comparison of the selectivity filter structures of NaK and KcsA and between various ion complexes of NaK. a) Superimposition of the NaK selectivity filter (yellow) in complex with K+ with that of KcsA (green, PDB code 1K4C). b) Superimposition of the selectivity filters of the NaKNΔ19 channel in complex with Na+ (yellow), K+ (green), and Rb+ (orange).

References

    1. Hille B. Ion Channels of Excitable Membranes. 3rd. Sinauer Associates, Inc.; Sunderland, MA: 2001.
    1. Long SB, et al. Atomic structure of a voltage-dependent K+ channel in a lipid membrane-like environment. Nature. 2007;450(7168):376–82. - PubMed
    1. Kuo A, et al. Crystal structure of the potassium channel KirBac1.1 in the closed state. Science. 2003;300(5627):1922–6. - PubMed
    1. Jiang Y, et al. The open pore conformation of potassium channels. Nature. 2002;417(6888):523–6. - PubMed
    1. Jiang Y, et al. X-ray structure of a voltage-dependent K+ channel. Nature. 2003;423(6935):33–41. - PubMed

Publication types

LinkOut - more resources