. 2016 Apr 29;291(18):9396-410.
doi: 10.1074/jbc.M116.715698. Epub 2016 Feb 22.

RNF8 E3 Ubiquitin Ligase Stimulates Ubc13 E2 Conjugating Activity That Is Essential for DNA Double Strand Break Signaling and BRCA1 Tumor Suppressor Recruitment

Affiliations

RNF8 E3 Ubiquitin Ligase Stimulates Ubc13 E2 Conjugating Activity That Is Essential for DNA Double Strand Break Signaling and BRCA1 Tumor Suppressor Recruitment

Curtis D Hodge et al. J Biol Chem. .

Abstract

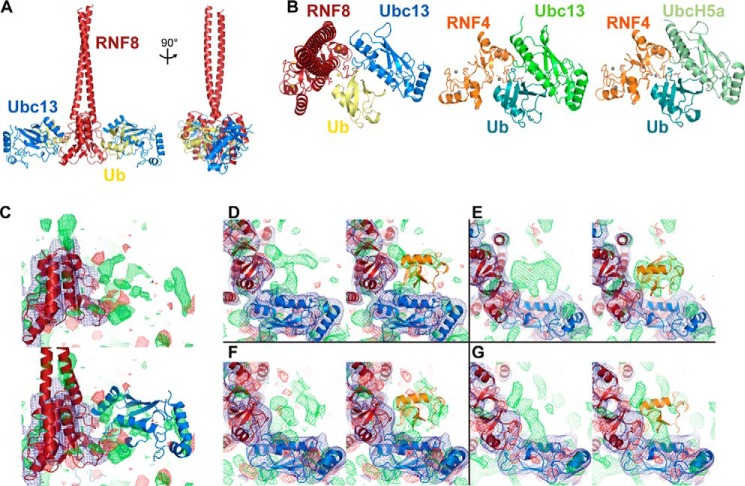
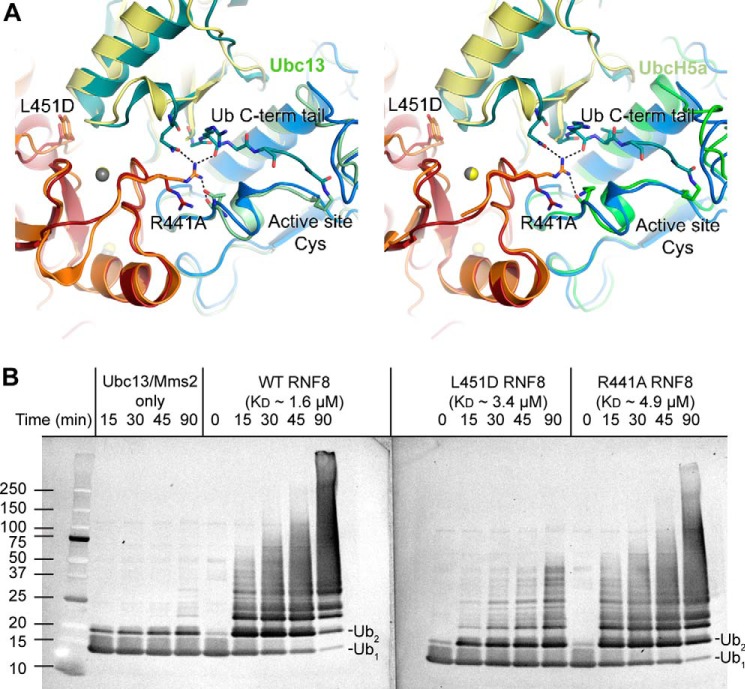
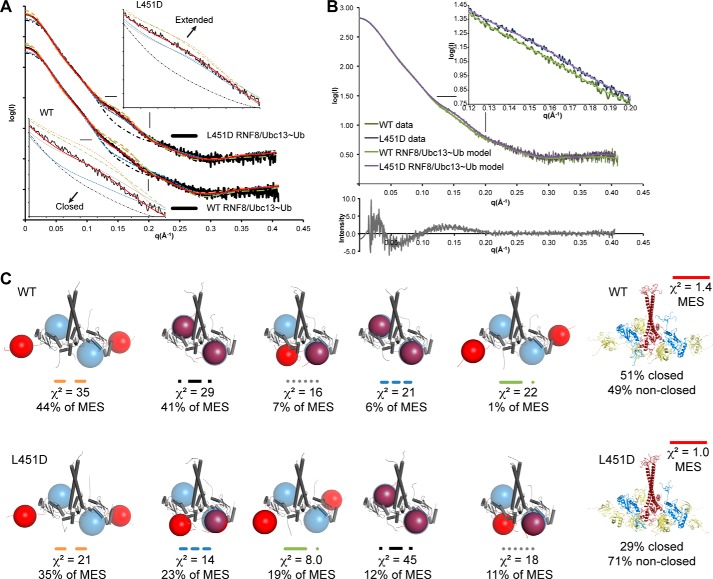
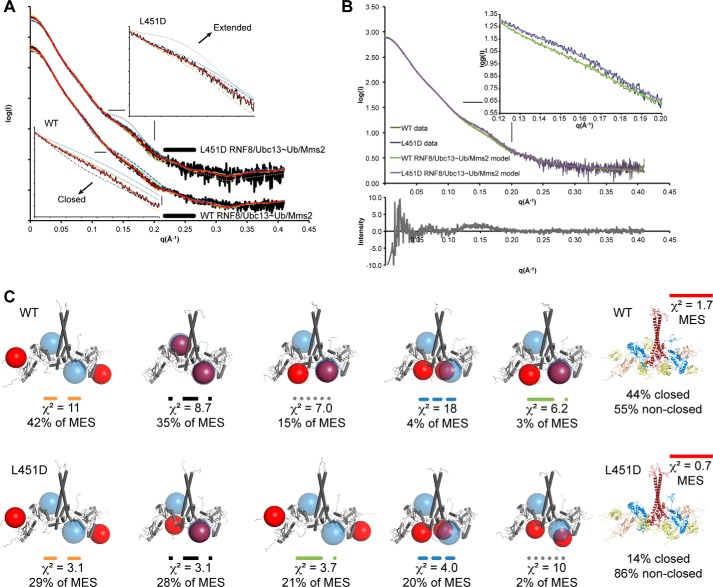
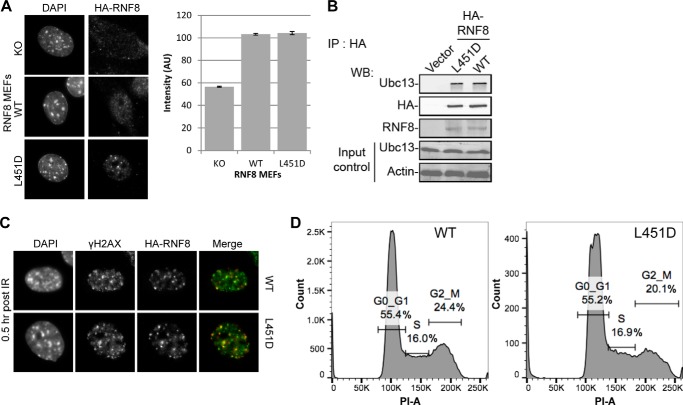
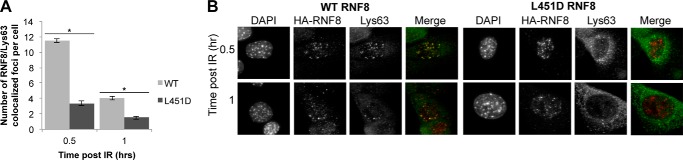
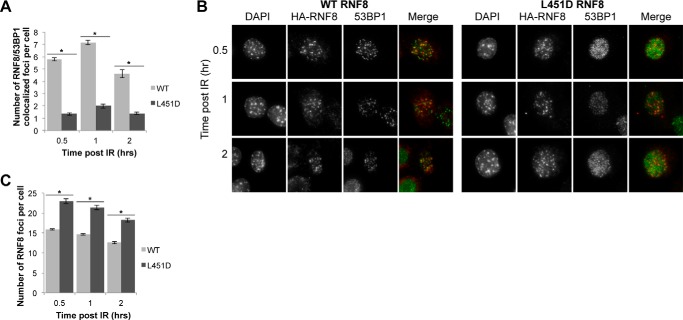
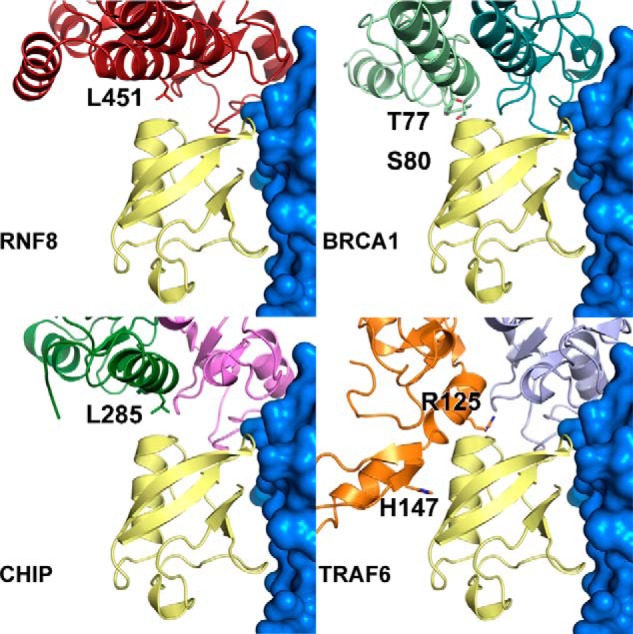
DNA double strand break (DSB) responses depend on the sequential actions of the E3 ubiquitin ligases RNF8 and RNF168 plus E2 ubiquitin-conjugating enzyme Ubc13 to specifically generate histone Lys-63-linked ubiquitin chains in DSB signaling. Here, we defined the activated RNF8-Ubc13∼ubiquitin complex by x-ray crystallography and its functional solution conformations by x-ray scattering, as tested by separation-of-function mutations imaged in cells by immunofluorescence. The collective results show that the RING E3 RNF8 targets E2 Ubc13 to DSB sites and plays a critical role in damage signaling by stimulating polyubiquitination through modulating conformations of ubiquitin covalently linked to the Ubc13 active site. Structure-guided separation-of-function mutations show that the RNF8 E2 stimulating activity is essential for DSB signaling in mammalian cells and is necessary for downstream recruitment of 53BP1 and BRCA1. Chromatin-targeted RNF168 rescues 53BP1 recruitment involved in non-homologous end joining but not BRCA1 recruitment for homologous recombination. These findings suggest an allosteric approach to targeting the ubiquitin-docking cleft at the E2-E3 interface for possible interventions in cancer and chronic inflammation, and moreover, they establish an independent RNF8 role in BRCA1 recruitment.

Keywords: 53BP1; BRCA1; DNA damage response; E3 ubiquitin-protein ligase RNF8 (RNF8); RNF168; Ubc13; cell biology; ubiquitylation (ubiquitination); x-ray crystallography; x-ray scattering.


Figures

FIGURE 1.
FIGURE 1.
RNF8-Ubc13∼Ub structure and comparison with RNF4-UbcH5a∼Ub. A, overview of RNF8-Ubc13∼Ub structure (Protein Data Bank accession 4WHV). RNF8 dimers are firebrick red; Ubc13s are blue; and ubiquitins are yellow. B, top-down view of singly loaded (one Ubc13 and one ubiquitin) RNF8 dimer (left), singly loaded (one Ubc13 and one ubiquitin) RNF4 dimer (middle; PDB 5AIU), and singly loaded (one UbcH5a and one ubiquitin) RNF4 dimer (right; PDB code 4AP4). RNF4 dimer is orange, Ubc13 is green in middle panel; UbcH5a is pale green, and ubiquitin is aqua green. C, electron density maps of RNF8-Ubc13∼Ub structure phased with an RNF8 dimer plus a single Ubc13. The difference density for the missing Ubc13 and RNF8 coiled coil is shown with a full RNF8 and Ubc13 model overlaid in the bottom panel. D–G, electron density maps for RNF8-Ubc13∼Ub with difference density prior to the introduction of ubiquitin chain A (D), chain F (E), chain G (F), or chain L (G) (left panels show ubiquitin density only; right panels show ubiquitin models in orange). For all maps, FoFc difference density contoured at σ = 2 is shown in green and red, and 2FoFc contoured at σ = 1 is shown in blue.
FIGURE 2.
FIGURE 2.
RNF8 mutations affect Ubc13 catalytic activity. A, close-up view of an alignment of the RNF8-Ubc13∼Ub structure (RNF8 is firebrick red; Ubc13 is blue, and ubiquitin is yellow) with the RNF4-Ubc13∼Ub (PDB code 5AIU; RNF4 is orange, Ubc13 is pale green, and ubiquitin is aqua green) and RNF4-UbcH5a∼Ub structure (PDB code 4AP4; RNF4 is orange, UbcH5a is pale green, and ubiquitin is aqua green). Residues proposed to be important for interactions between the E2s, E3s, and ubiquitin are shown as sticks; note that side chain residues in the RNF8-Ubc13∼Ub complex are inferred from higher resolution structures (PDB codes 4AYC and 5AIU). B, in vitro ubiquitination assays in which purified RNF8 (WT, L451D, or R441A) was incubated with Ubc13/Mms2, ubiquitin, ATP, and E1 enzyme for the indicated time before quenching. Results were visualized via Western blotting using an anti-ubiquitin antibody. Mono- and diubiquitin species are indicated. The approximate dissociation constants (KD) for the interactions of each of the RNF8 proteins with Ubc13 as determined by SPR are indicated.
FIGURE 3.
FIGURE 3.
RNF8-ubiquitin interface mutations do not significantly affect binding to Ubc13. A, steady state affinity analysis of the RNF8 SPR curves of WT, L451D, and R441A demonstrating binding to chip-conjugated Ubc13. Ubiquitin was run as a negative control. The saturation point for wild type, L451D, and R441A RNF8 binding to Ubc13 was estimated from a hyperbolic non-linear regression fit to duplicate data sets, and the predicted Rmax value of each curve was set to 100% for normalization. The response 20 s after the injection start was used for the steady state affinity calculation to avoid background RNF8 binding effects at higher concentrations. The estimated apparent equilibrium constants (KD) were determined using a fractional saturation analysis (63) in SigmaPlot. B, WT, L451D, and R441A RNF8 constructs form complexes with Ubc13 as determined by analytical size exclusion chromatography. Ubc13 and each of the RNF8 constructs were run alone as controls and are overlaid on each of the complex curves.
FIGURE 4.
FIGURE 4.
SAXS analysis of WT and L451D RNF8-Ubc13∼Ub complexes. A, plot of the extrapolated experimental SAXS curve is shown as a black solid line. The selected models that compose the MES ensemble (red) are overlaid in various colors and line types. Close-up views between q(Å−1) 0.12 and 0.2 for WT (bottom left) and L451D (top right) RNF8-Ubc13∼Ub of the scattering curves are shown. B, top panel, WT and L451D RNF8-Ubc13∼Ub SAXS curves were scaled, and lines of best fit were calculated in Primus (inset panel is close-up of the 0.12 < q < 0.2 Å−1 region). Bottom panel shows a plot of a difference SAXS spectrum in which the scaled intensity of the RNF8 WT complex is subtracted from the scaled intensity of the RNF8 L451D complex. C, schematic representations of the individual models that comprise the MES for each complex are shown. Colored lines above the models correspond to curves overlaid in A. The relative weighting of each model to the overall MES is listed as a percentage, and the goodness of fit (χ2) of each individual model to the experimental data is indicated. Blue spheres represent the closed ubiquitin position, and red spheres represent ubiquitin. The purple spheres indicate overlapping blue and red indicating ubiquitin in a closed position. SAXS curves have been deposited to SASBDB: WT RNF8-Ubc13∼Ub (SASDBR3); L451D RNF8-Ubc13∼Ub (SASDBT3).
FIGURE 5.
FIGURE 5.
WT and L451D RNF8-Ubc13∼Ub/Mms2 complex SAXS curve analysis. A, plot of the extrapolated experimental SAXS curve is shown as a black solid line. The selected models that compose the MES ensemble (red) are overlaid in various colors and line types. Close-up views between q(Å−1) 0.12 and 0.2 for WT (bottom left) and L451D (top right) RNF8-Ubc13∼Ub/Mms2 of the scattering curves are shown. B, top panel, WT and L451D RNF8-Ubc13∼Ub/Mms2 SAXS curves were scaled, and lines of best fit were calculated in Primus (inset panel is a close-up of the 0.12 < q < 0.2 Å−1 region). Bottom panel shows a plot of a difference SAXS spectrum in which the scaled intensity of the RNF8 WT complex is subtracted from the scaled intensity of the RNF8 L451D complex. C, schematic representations of the individual models that comprise the MES for each complex are shown. Colored lines above the models correspond to curves overlaid in A. The relative weighting of each model to the overall MES is listed as a percentage, and the goodness of fit (χ2) of each individual model to the experimental data is indicated. Blue spheres represent the closed ubiquitin position, and red spheres represent ubiquitin. The purple spheres indicate overlapping blue and red indicating ubiquitin in a closed position. SAXS curves have been deposited to SASBDB: WT RNF8-Ubc13∼Ub/Mms2 (SASDBS3); L451D RNF8-Ubc13∼Ub/Mms2 (SASDBU3).
FIGURE 6.
FIGURE 6.
RNF8 levels are similar in the WT and L451D MEF populations. A, anti-HA antibody was used to stain RNF8 knock-out (KO), WT, and L451D MEFs (left panel). The nuclear intensity of HA-RNF8 was quantified in arbitrary units (AU) (right panel). The nonspecific nuclear HA stain of the KO cells was used to determine a threshold to filter out any non-reconstituted cells, and the nuclear intensity of HA-RNF8 was quantified for the remaining WT and L451D MEFs. The tonal range of cell images was rescaled from 0 to 255 in Photoshop to increase the overall contrast for display in the representative image. B, immunoprecipitation using an anti-HA antibody to detect WT or L451D HA-RNF8 in complex with endogenous Ubc13. The HA-tagged RNF8 wild type (WT) or L451D (L451D) were expressed in RNF8 knock-out mouse embryonic fibroblasts, and their interaction was measured by immunoprecipitation with anti-HA antibody followed by immunoblotting with the indicated antibodies. The tonal range of whole images was rescaled from 0 to 255 to increase the overall contrast for display. C, γH2AX/RNF8 colocalized foci 0.5 h after ionizing radiation in both wild type and L451D RNF8 reconstituted MEFs. RNF8 foci are red, and γH2AX are green in the merged images. The tonal range of whole images was rescaled from 0 to 255 in Photoshop to increase the overall contrast for display. D, DNA content of wild type and L451D RNF8 reconstituted MEFs was analyzed via propidium iodide staining and flow cytometry. The percentages of cells in G0/G1, S, and G2/M phases are indicated. At least 20,000 cells per cell line were measured and analyzed.
FIGURE 7.
FIGURE 7.
RNF8 L451D mutation sharply reduces Lys-63-linked polyubiquitin chain formation in MEF cells. A, RNF8/Lys-63 colocalized foci per cell for WT or L451D cells from 0.5 to 1 h post 3 Gy of ionizing radiation. B, representative image of the RNF8 L451D mutation on DNA DSB repair via an RNF8/Lys-63 IRIF time course. Wild type RNF8 reconstituted MEFs are in the left panel and L451D RNF8 MEFs are in the right panel. RNF8 is red, and Lys-63 is green in the merged images. The tonal range of cell images was rescaled from 0 to 255 in Photoshop to increase the overall contrast for display. Cells with ≥20 RNF8 foci per cell were examined to ensure only RNF8-positive cells were analyzed, to avoid inclusion of spurious non-IR induced foci, and increased diffuse background stain in later time points. The experiment was done in triplicate, and data were pooled with at least 200 cells per time point, and standard error of the mean is included. *, p < 0.005 comparing WT and L451D for each time point using a two-tailed Student's t test.
FIGURE 8.
FIGURE 8.
Effects of the RNF8 L451D mutation on DNA DSB repair via a RNF8/53BP1 IRIF time course. A, RNF8/53BP1 colocalized foci per cell for WT or L451D cells from 0.5 to 2 h post 3 Gy of ionizing radiation. B, representative image of the RNF8 L451D mutation on DNA DSB repair via a RNF8/53BP1 IRIF time course. Wild type RNF8 reconstituted MEFs are in the left panel, and L451D RNF8 MEFs are in the right panel. RNF8 is red, and 53BP1 is green in the merged images. The tonal range of cell images was rescaled from 0 to 255 in Photoshop to increase the overall contrast for display. C, individual assessment of the RNF8 foci per cell of WT and L451D cells. Cells with ≥10 RNF8 foci per cell were examined to ensure only RNF8-positive cells were analyzed, to avoid inclusion of spurious non-IR induced foci, and increased diffuse background stain in later time points. The experiment was done in triplicate, and data were pooled with at least 120 cells per time point and standard error of the mean is included. *, p < 0.005 comparing WT and L451D for each time point using a two-tailed Student's t test.
FIGURE 9.
FIGURE 9.
Targeting of RNF168 to sites of DNA DSBs in the absence of its MIUs using a BRCT chimera. RNF8 knock-out MEFs were transfected with different chimeric constructs as indicated for 24 h. Cells were then irradiated with 2 Gy and left to recover for 30 min at 37 °C. Cells were then fixed and stained as indicated. A, mock transfection treatment. B, GFP-RNF8 transfection into RNF8−/− MEFs. C, GFP-L451D RNF8 transfection into RNF8−/− MEFs. D, GFP-RNF168-dMIU transfected into RNF8−/− MEFs. E, GFP-RNF168-dMIU-BRCT transfected into RNF8−/− MEFs. F, GFP-RNF168-dMIU transfected into RNF8−/− MEFs stably reconstituted with RNF8 L451D. G, GFP-RNF168-dMIU-BRCT transfected into RNF8−/− MEFs stably reconstituted with RNF8 L451D. Cells were stained with primary antibodies against 53BP1, BRCA1, and FK2 as detailed under “Experimental Procedures.” H, quantification of the percentage of cells with GFP-positive DNA repair protein foci. Error bars represent standard deviation of three independent experiments with total number of cells equal to 20. GFP-RNF8 constructs in B and C are not fusion proteins but instead indicate transient coexpression of separate GFP and RNF8 polypeptides from the same expression vector. The GFP stain is therefore not expected to form foci but serves as a transfection control. Schematic of RNF168 chimeras in which the RNF168 MIUs were either removed or replaced with MDC1 BRCT domain are shown above graph.
FIGURE 10.
FIGURE 10.
Comparisons of RING E3 dimers and heterodimers relative to E2∼Ub. The E2s of the BARD1-BRCA1 (teal/green; PDB code 1JM7), CHIP (green/violet; PDB code 2C2V), and TRAF6 (orange; PDB code 3HCS) structures were superimposed on the Ubc13 in the RNF8-Ubc13∼Ub (red/blue) crystal structure. Possible interacting residues are labeled. The TRAF6 structure includes a zinc finger connected to its RING. In all images Ubc13 is blue with surface representation, and ubiquitin is yellow.

References

    1. Pickart C. M., and Eddins M. J. (2004) Ubiquitin: structures, functions, mechanisms. Biochim. Biophys. Acta 1695, 55–72 - PubMed
    1. Haas A. L., and Siepmann T. J. (1997) Pathways of ubiquitin conjugation. FASEB J. 11, 1257–1268 - PubMed
    1. Dye B. T., and Schulman B. A. (2007) Structural mechanisms underlying posttranslational modification by ubiquitin-like proteins. Annu. Rev. Biophys. Biomol. Struct. 36, 131–150 - PubMed
    1. Komander D., and Rape M. (2012) The ubiquitin code. Annu. Rev. Biochem. 81, 203–229 - PubMed
    1. Metzger M. B., Pruneda J. N., Klevit R. E., and Weissman A. M. (2014) RING-type E3 ligases: master manipulators of E2 ubiquitin-conjugating enzymes and ubiquitination. Biochim. Biophys. Acta 1843, 47–60 - PMC - PubMed

Publication types

MeSH terms

LinkOut - more resources