. 2011 Aug 21;18(9):1028-35.
doi: 10.1038/nsmb.2106.

An unusual dimeric structure and assembly for TLR4 regulator RP105-MD-1

Affiliations

An unusual dimeric structure and assembly for TLR4 regulator RP105-MD-1

Sung-il Yoon et al. Nat Struct Mol Biol. .

Abstract

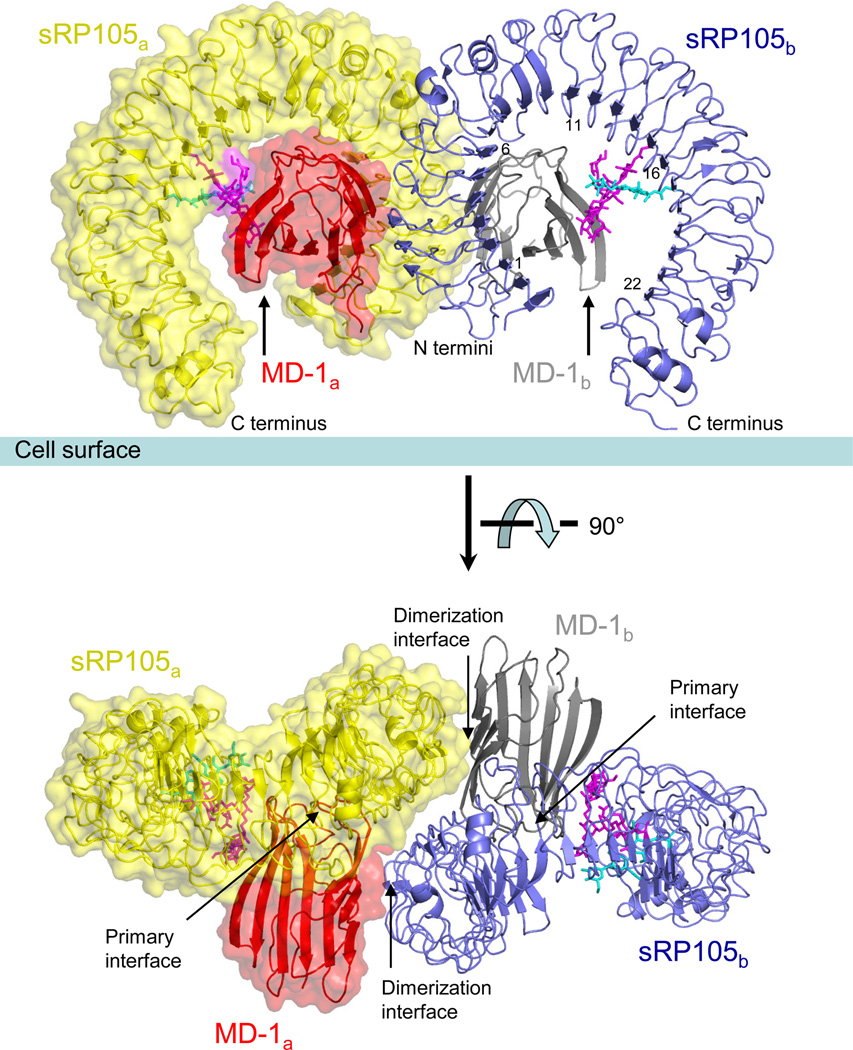
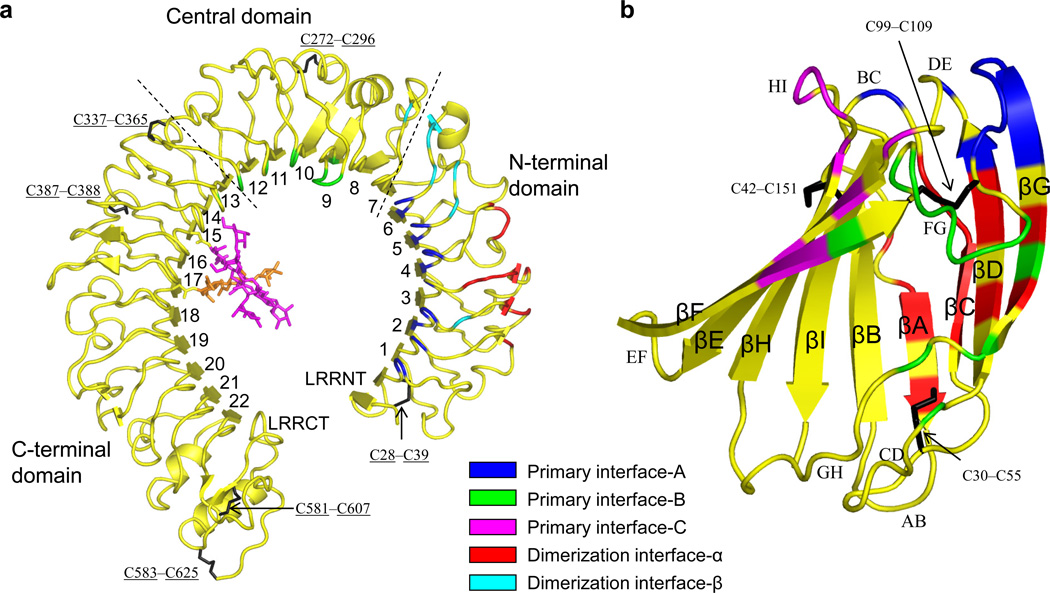
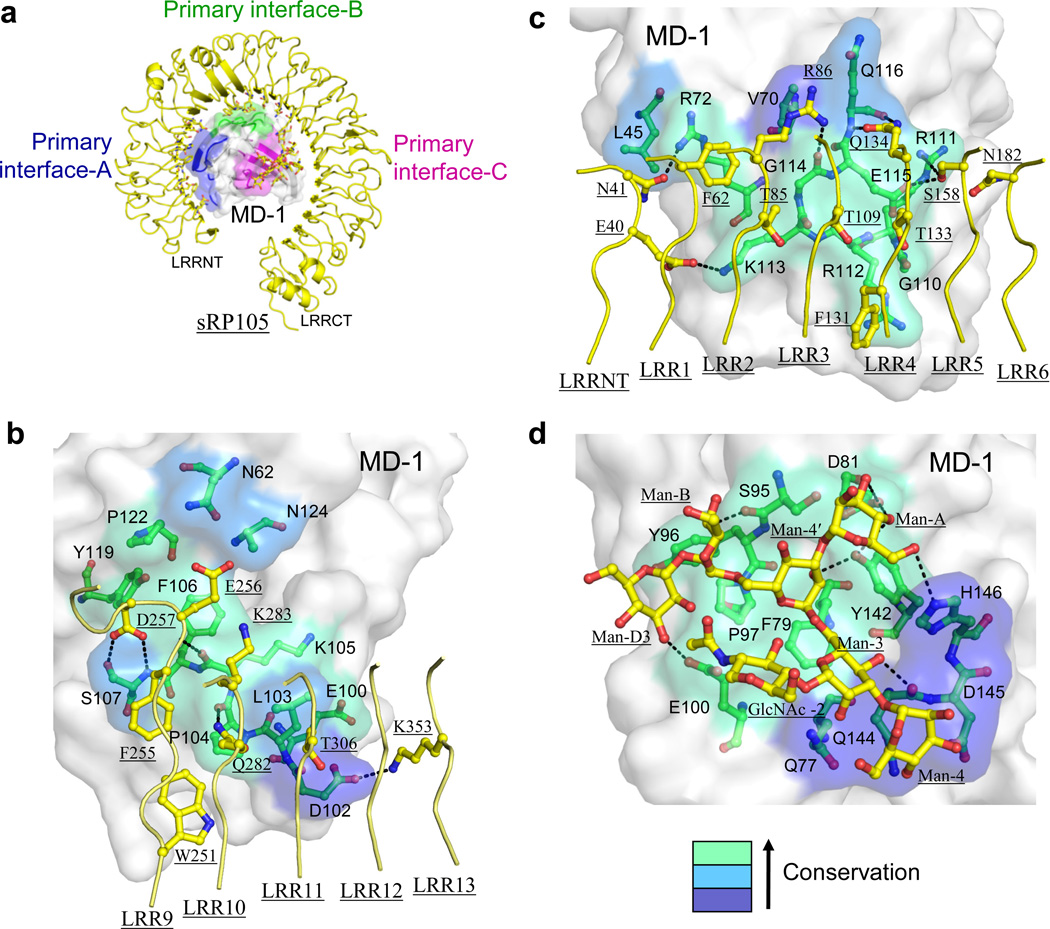
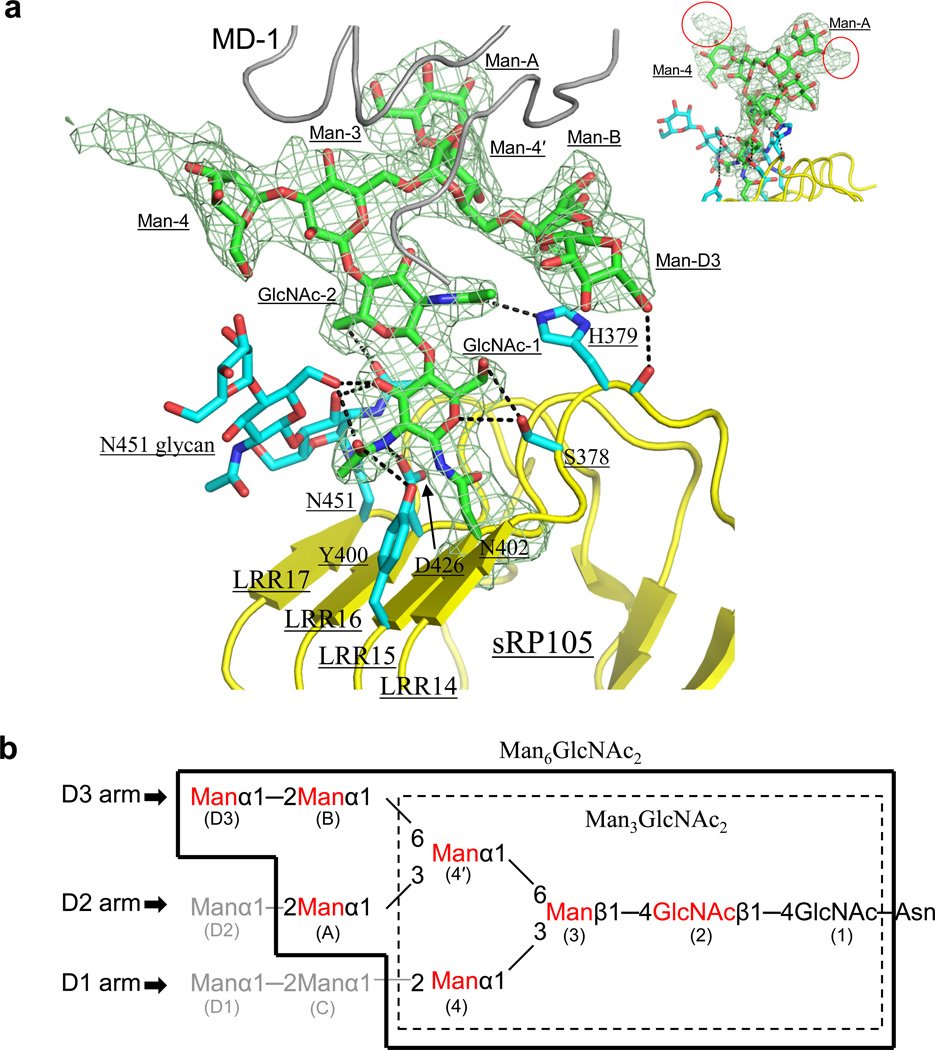
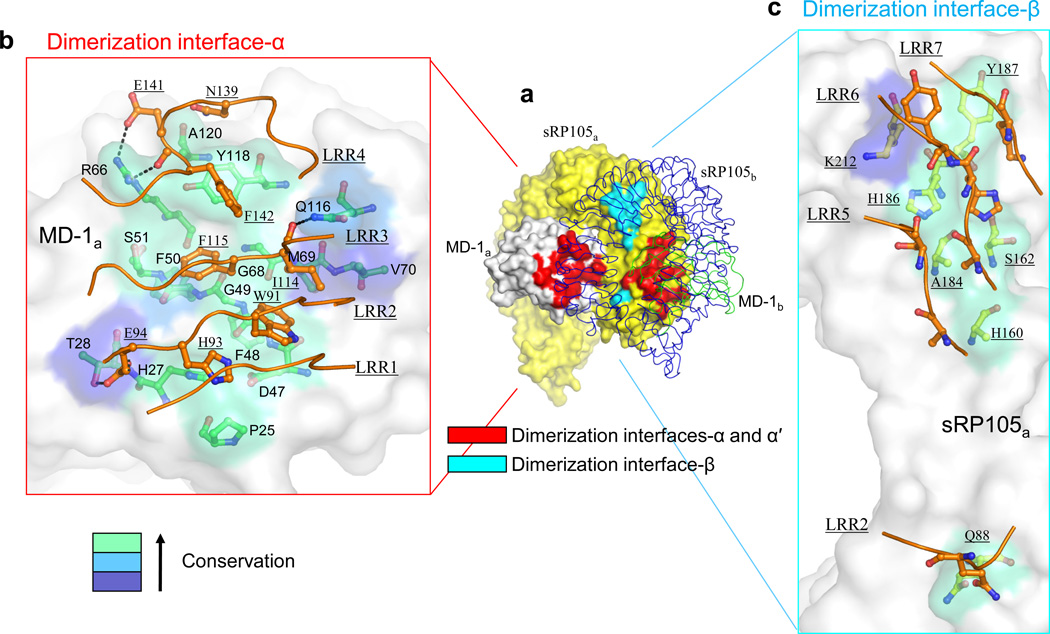
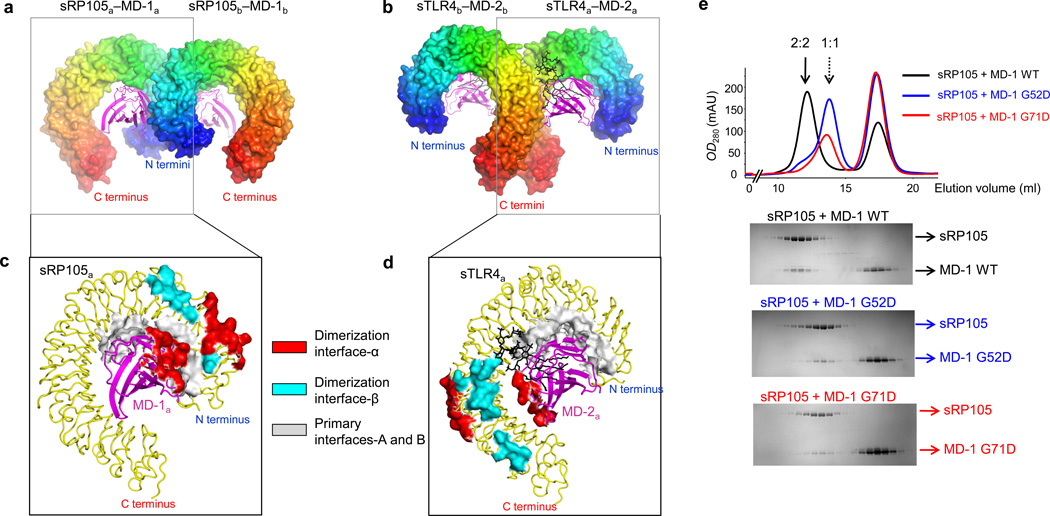
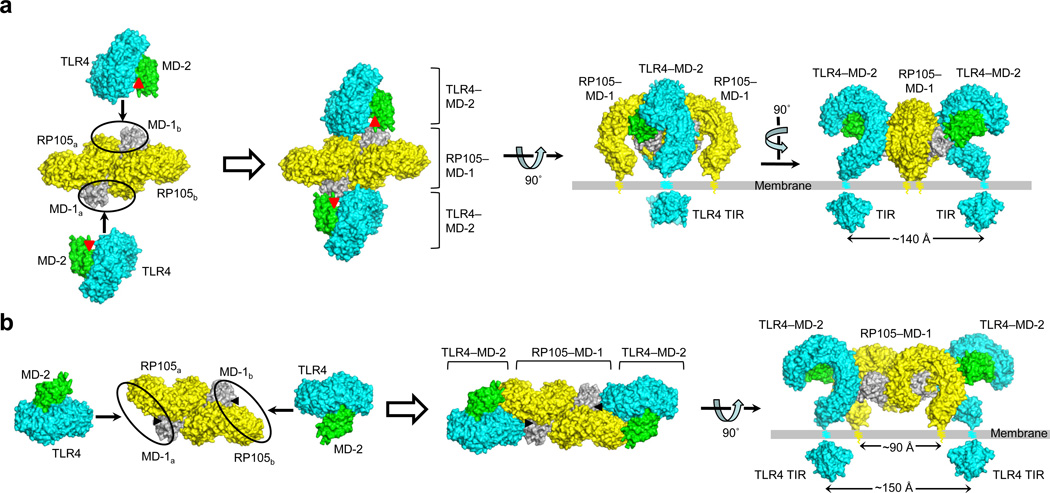
RP105-MD-1 modulates the TLR4-MD-2-mediated, innate immune response against bacterial lipopolysaccharide (LPS). The crystal structure of the bovine 1:1 RP105-MD-1 complex bound to a putative endogenous lipid at 2.9 Å resolution shares a similar overall architecture to its homolog TLR4-MD-2 but assembles into an unusual 2:2 homodimer that differs from any other known TLR-ligand assembly. The homodimer is assembled in a head-to-head orientation that juxtaposes the N-terminal leucine-rich repeats (LRRs) of the two RP105 chains, rather than the usual tail-to-tail configuration of C-terminal LRRs in ligand-activated TLR dimers, such as TLR1-TRL2, TLR2-TLR6, TLR3-TLR3 and TLR4-TLR4. Another unusual interaction is mediated by an RP105-specific asparagine-linked glycan, which wedges MD-1 into the co-receptor binding concavity on RP105. This unique mode of assembly represents a new paradigm for TLR complexes and suggests a molecular mechanism for regulating LPS responses.


Figures

Figure 1
Figure 1
Overall architecture of the 2:2 sRP105–MD-1 complex. The 1:1 sRP105–MD-1 building block that corresponds to unliganded 1:1 sTLR4–MD-2 complex is designated by sRP105a–MD-1a (yellow–red, solid surface with underlying ribbon representation) or (blue–gray, ribbon only). The 1:1 complex formation is driven by the primary binding interface between RP105 and MD-1. Two copies of the 1:1 complex associate in a symmetrical manner in a head-to-head mode through a unique dimerization interface that stabilizes the 2:2 complex. RP105 Asn402- and Asn451-linked glycans that are well ordered in the sRP105a–MD-1a or sRP105b–MD-1b interface region are shown in magenta and cyan stick models, respectively. Two views are shown parallel to the cell surface and from the top looking down onto the cell surface.
Figure 2
Figure 2
sRP105 and MD-1 structures as observed in the 2:2 complex. (a,b) The sRP105 (a) and MD-1 (b) structures are represented by yellow ribbon diagrams and the components of the structure that form each binding interface are colored as indicated in the figure. The Asn-linked glycan at sRP105 Asn402, which is involved in primary interface-C, is shown in magenta sticks and the nearby glycan at Asn451 is in orange. Disulfide bonds are shown in black sticks. sRP105 is divided into three subdomains as indicated by dashed lines that correspond to those designated previously in TLR4 as the N-terminal, central and C-terminal domains.
Figure 3
Figure 3
The sRP105–MD-1 primary interaction. (a) Overall view of the 1:1 sRP105–MD-1 complex. The 1:1 complex is represented by a ribbon diagram (sRP105, yellow; MD-1, gray) and primary interfaces-A, B, and C are colored in blue, green, and magenta, respectively, on the MD-1 surface. sRP105 primary interface residues are shown in stick models (carbon, yellow; oxygen, red; nitrogen, blue). (b–d) Close-up view of primary interfaces-A (b), B (c), and C (d). Interfaces-A and B correspond to A patch and B patch, respectively, as designated in TLR4–MD-2. MD-1 and sRP105 residues in the primary interface are shown in green and yellow ball-and-stick models, respectively, with oxygens in red and nitrogens in blue. The MD-1 interface is color-coded on a surface representation according to sequence conservation among ten MD-1 orthologs from light green (most conserved) to dark blue (less conserved). Broken dotted lines represent H-bonds or salt bridges.
Figure 4
Figure 4
sRP105-specific glycan at Asn402. (a) Asn402-linked glycan (green sticks) is stabilized by interactions with neighboring sRP105 protein residues, as well as with Asn451-linked glycan (cyan sticks). H-bonds are represented by broken lines. Electron density for the Asn402-linked glycan is shown in a pale green mesh at a 1.0 σ level in a 2Fo-Fc map. The sRP105 and MD-1 Cα traces are colored in yellow and gray, respectively. Residual electron density observed beyond Man-A and Man-4 sugars of glycan at Asn402 are circled in red in the inset (top right) and suggest that the glycan is Man89GlcNAc2. (b) Schematic diagram of an Asn-linked high mannose glycan, Man9GlcNAc2. The most frequently found Asn-linked glycan in insect cells, Man3GlcNAc2, is boxed in dashed lines. Asn402-linked glycan (Man6GlcNAc2) that was built in the sRP105 structure is enclosed by thick lines. Glycan residues that make contacts with MD-1 are colored in red. The standard nomenclature of each sugar moiety is shown in parenthesis.
Figure 5
Figure 5
The unique sRP105–MD-1 homodimerization interaction for assembly of the 2:2 complex. (a) Overall view of the 2:2 sRP105–MD-1 complex. 1:1 sRP105a–MD-1a and sRP105b–MD-1b complexes are shown in a surface representation (yellow sRP105a, gray MD-1a) and in thin coils (blue sRP105b, green MD-1b), respectively. The dimerization interface is colored in red (interfaces-α and -α′) and cyan (interface-β) on the surface representation sRP105a–MD-1a. (b) Close-up view of dimerization interface-α. MD-1a and sRP105b residues in the dimerization interface-α are shown with green and orange carbons (red oxygens, blue nitrogens) in ball-and-stick models, respectively. The MD-1a interface is color-coded on the surface representation by sequence conservation as Fig. 3. Broken dotted lines represent H-bonds or salt bridges. (c) Close-up view of dimerization interface-β. The sRP105a and sRP105b residues in the dimerization interface-β are shown in green and orange ball-and-stick models, respectively. The RP105a interface is color-coded on the surface representation according to sequence conservation in four RP105 orthologs, as in Fig. 3.
Figure 6
Figure 6
Different organization of the 2:2 sRP105–MD-1 and 2:2 LPS-bound sTLR4–MD-2 homodimeric assemblies. (a,b) The head-to-head homodimer of 2:2 sRP105–MD-1 (a) and the tail-to-tail homodimer of 2:2 LPS-bound TLR4–MD-2 (PDB ID code 3fxi) (b). The surface representations of sRP105 and sTLR4 are rainbow-colored from N-terminus (blue) and to C-terminus (red). MD-1 and MD-2 are shown in magenta ribbons. LPS bound to sTLR4–MD-2 is represented by black sticks. (c,d) Close-up views of 1:1 sRP105a–MD-1a (c) and 1:1 sTLR4a–MD-2a (d). The distinct dimerization interfaces of 2:2 sRP105–MD-1 and TLR4–MD-2 are shown as red and cyan surface representation over the ribbon diagram of their respective 1:1 complexes. For comparison, the similar primary interfaces-A and B are shown in gray surface representation. (e) The unique head-to-head arrangement of sRP105–MD-1 is verified by mouse MD-1 mutants, G52D and G71D, which do not permit homodimerization of the sRP105–MD-1 complex. sRP105 co-expressed with an excess of MD-1 WT or mutants was analyzed by gel filtration chromatography (Top) and its fractions were resolved by SDS-PAGE (Bottom).
Figure 7
Figure 7
Two possible models for the interaction between RP105–MD-1 and TLR4–MD-2. (a,b) Binding models 1 (a) and 2 (b). Potential TLR4–MD-2 binding sites on RP105–MD-1 are highlighted by black circles in left panels and their resulting complexes are shown in right panels. The sRP105–MD-1 (yellow–gray) and sTLR4–MD-2 (cyan–green) structures are shown by surface representation. MD-2 (a) and MD-1 (b) cavities that accommodate LPS molecules are represented by red and black triangles, respectively. Currently, we favor model 2.

References

    1. Bell JK, et al. Leucine-rich repeats and pathogen recognition in Toll-like receptors. Trends Immunol. 2003;24:528–533. - PubMed
    1. Takeda K, Kaisho T, Akira S. Toll-like receptors. Annu Rev Immunol. 2003;21:335–376. - PubMed
    1. Proell M, Riedl SJ, Fritz JH, Rojas AM, Schwarzenbacher R. The Nod-like receptor (NLR) family: a tale of similarities and differences. PLoS One. 2008;3:e2119. - PMC - PubMed
    1. Nakhaei P, Genin P, Civas A, Hiscott J. RIG-I-like receptors: sensing and responding to RNA virus infection. Semin Immunol. 2009;21:215–222. - PubMed
    1. Kim HM, et al. Crystal structure of the TLR4-MD-2 complex with bound endotoxin antagonist Eritoran. Cell. 2007;130:906–917. - PubMed

Publication types

Associated data