. 2016 Jan 15;291(3):1175-97.
doi: 10.1074/jbc.M115.691659. Epub 2015 Oct 27.

Structure-Function Analysis of a Mixed-linkage β-Glucanase/Xyloglucanase from the Key Ruminal Bacteroidetes Prevotella bryantii B(1)4

Affiliations

Structure-Function Analysis of a Mixed-linkage β-Glucanase/Xyloglucanase from the Key Ruminal Bacteroidetes Prevotella bryantii B(1)4

Nicholas McGregor et al. J Biol Chem. .

Abstract

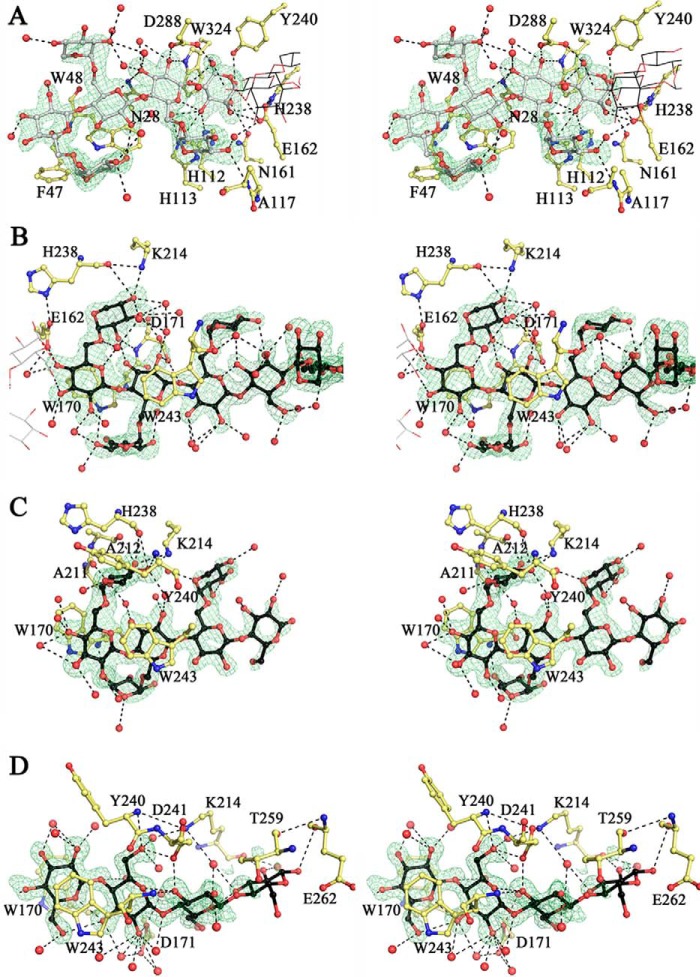
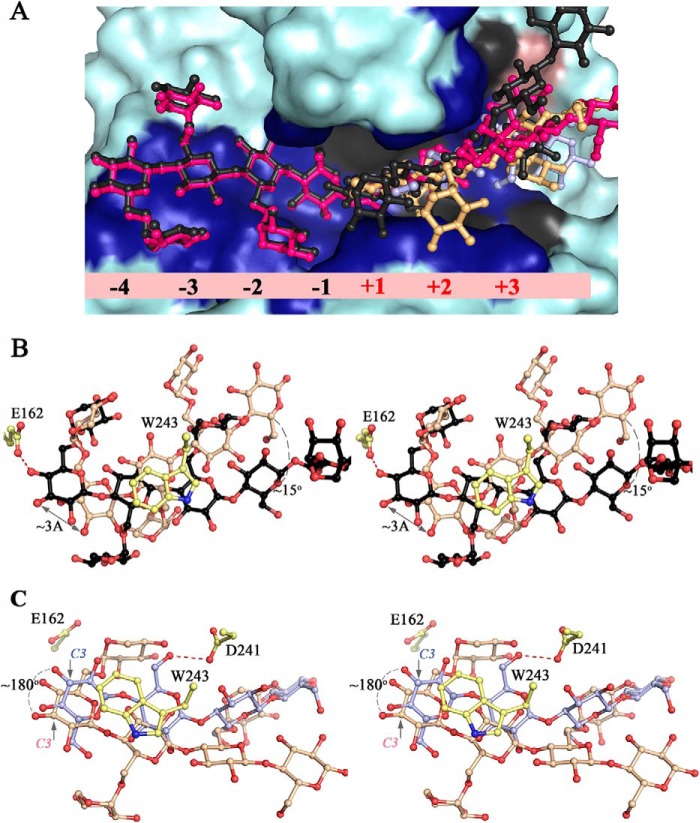
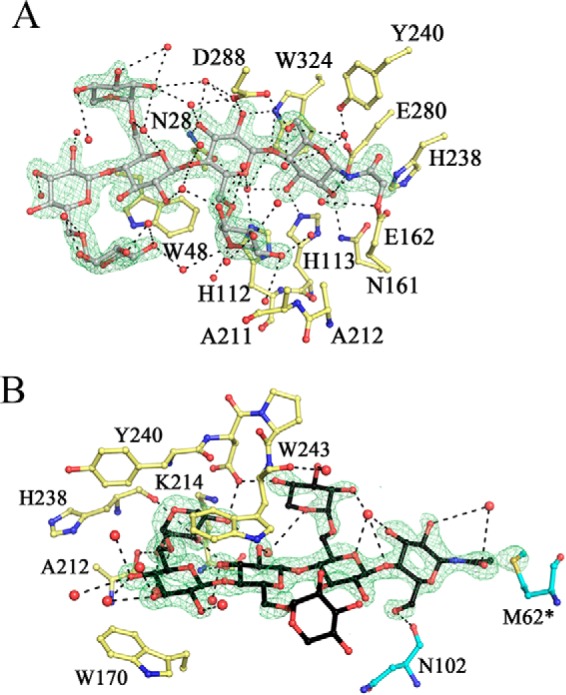
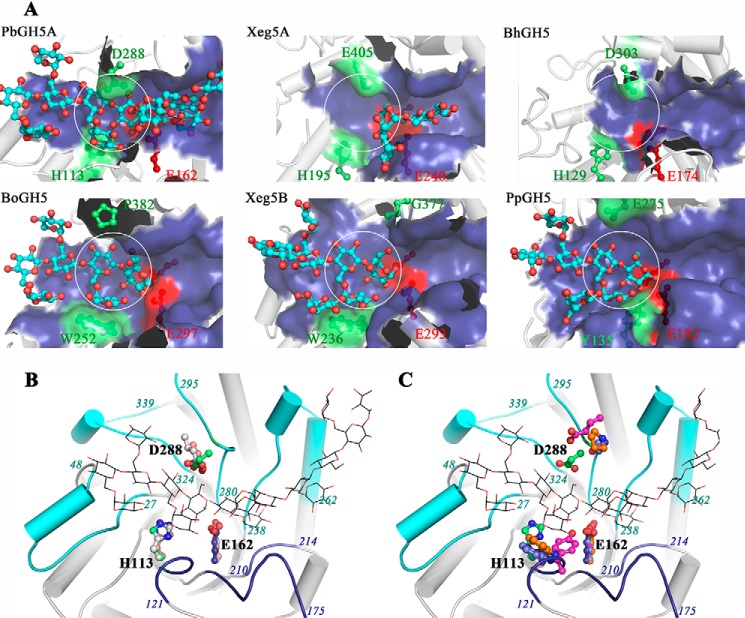
The recent classification of glycoside hydrolase family 5 (GH5) members into subfamilies enhances the prediction of substrate specificity by phylogenetic analysis. However, the small number of well characterized members is a current limitation to understanding the molecular basis of the diverse specificity observed across individual GH5 subfamilies. GH5 subfamily 4 (GH5_4) is one of the largest, with known activities comprising (carboxymethyl)cellulases, mixed-linkage endo-glucanases, and endo-xyloglucanases. Through detailed structure-function analysis, we have revisited the characterization of a classic GH5_4 carboxymethylcellulase, PbGH5A (also known as Orf4, carboxymethylcellulase, and Cel5A), from the symbiotic rumen Bacteroidetes Prevotella bryantii B14. We demonstrate that carboxymethylcellulose and phosphoric acid-swollen cellulose are in fact relatively poor substrates for PbGH5A, which instead exhibits clear primary specificity for the plant storage and cell wall polysaccharide, mixed-linkage β-glucan. Significant activity toward the plant cell wall polysaccharide xyloglucan was also observed. Determination of PbGH5A crystal structures in the apo-form and in complex with (xylo)glucan oligosaccharides and an active-site affinity label, together with detailed kinetic analysis using a variety of well defined oligosaccharide substrates, revealed the structural determinants of polysaccharide substrate specificity. In particular, this analysis highlighted the PbGH5A active-site motifs that engender predominant mixed-linkage endo-glucanase activity vis à vis predominant endo-xyloglucanases in GH5_4. However the detailed phylogenetic analysis of GH5_4 members did not delineate particular clades of enzymes sharing these sequence motifs; the phylogeny was instead dominated by bacterial taxonomy. Nonetheless, our results provide key enzyme functional and structural reference data for future bioinformatics analyses of (meta)genomes to elucidate the biology of complex gut ecosystems.

Keywords: Bacteroidetes; affinity labeling; carbohydrate chemistry; enzyme inhibitor; enzyme kinetics; microbiome; plant cell wall; polysaccharide; structural biology; structure-function.


Figures

FIGURE 1.
FIGURE 1.
Polysaccharide structures. A, structure of tamarind xyloglucan depicting the repeating Glc4 oligosaccharide moiety and variable galactosylation (a, b = 0 or 1). The primary site of PbGH5A attack (and canonical cleavage site of XyG) is marked with a solid arrow, and the secondary site is marked with a dashed arrow. B, structure of barley β(1,3)/β(1,4)-mixed linkage glucan (depicting GGG3GG). The primary and secondary sites of PbGH5A attack are indicated as for tXyG.
FIGURE 2.
FIGURE 2.
pH-rate profiles. A, activity of PbGH5A on 0.5 mm GGG-CNP in various buffers across a range of pH at 37 °C. Error bars are the standard deviation of three single-point replicates. The values (excluding the Tris series) were fit to determine the pH optimum (pH 5) and apparent kinetic pKa values (3.5 and 6.5). B, activity of PbGH5A on 1 mg/ml bMLG in various buffers across a range of pH at 37 °C. Each point is the average of two replicates.
FIGURE 3.
FIGURE 3.
Thermal stability. A, activity of PbGH5A on 1 mg/ml bMLG in pH 5.5 NH4OAc as a function of temperature. The reaction was incubated for 15 min to minimize instability effects. Each point is the average of two single-point replicates after subtraction of a boiled-enzyme control. B, long term thermal stability of PbGH5A in pH 5 citrate buffer across a range of temperatures over 4 h. After incubation at temperature, the enzyme was diluted and assayed using 0.2 mm XXXG-CNP.
FIGURE 4.
FIGURE 4.
Polysaccharide specificity. A, Michaelis-Menten plots of PbGH5A acting on various β-glucan substrates. Activities were measured as rates of reducing-end production using the BCA assay. B, graphical expansion of data for tXyG, kGM, CMC, HEC, PASC, bX, and wheat arabinoxylan (wAX) from A.
FIGURE 5.
FIGURE 5.
HPAEC-PAD chromatograms of the limit digests of bMLG (A) and tXyG (B) hydrolyzed by PbGH5A. Identifiable hydrolysis products are labeled. XLLGX and XLG/LXG have been identified by mass spectrometry but have not been unambiguously assigned as the chromatographic peaks specified.
FIGURE 6.
FIGURE 6.
Michaelis-Menten plots for the hydrolysis of various chromogenic substrates by PbGH5A. Activities are measured as CNP or PNP release rates measured by monitoring A405 over time. Error bars represent the fitting error of each measured rate. A–F, Michaelis-Menten plots for the hydrolysis of cellobiose-CNP, cellotriose-CNP, cellotetraose-CNP, XXXG-CNP, cellobiose-PNP, and cellotriose-PNP by PbGH5A, respectively.
FIGURE 7.
FIGURE 7.
Michaelis-Menten plots for the hydrolysis of various model oligosaccharides by PbGH5A. Activities are measured as the rate of increase in product peak integration using HPAEC-PAD. Error bars represent the fitting error of each measured rate. A–C, Michaelis-Menten plots for the hydrolysis of cello-oligosaccharides (GGGG, GGGGG, and GGGGGG) by PbGH5A. D–F, Michaelis-Menten plots for the hydrolysis of mixed-linkage glucan oligosaccharides (GG3GG, GGG3G, and G3GGG3GGG) by PbGH5A. G, Michaelis-Menten plot for the hydrolysis of XXXGXXXG by PbGH5A.
FIGURE 8.
FIGURE 8.
HPAEC-PAD product analysis of the digestion of cellohexaose by PbGH5A.
FIGURE 9.
FIGURE 9.
Mass spectrum of the products of cellopentaose degradation by PbGH5A in H218O. A, isotopic distribution of produced cellobiose. No increase in the M + 2 peak indicates no 18O incorporation. B, isotopic distribution of produced cellotriose showing significant increase in the M + 2 peak intensity.
FIGURE 10.
FIGURE 10.
Inhibition of PbGH5A with active-site affinity labels. A and C, inhibition of PbGH5A with compound 1. A, plot of reaction velocity versus time at different inhibitor concentrations. C, plot of pseudo first-order rate constants versus inhibitor concentration. B and D, inhibition of PbGH5A with compound 2. B, plot of reaction velocity versus time at different inhibitor concentrations. D, plot of pseudo first-order rate constants versus inhibitor concentration. Error bars represent the fitting error of the exponential decay function. E, chemical structure of inhibitor compound 1. F, chemical structure of inhibitor 2.
FIGURE 11.
FIGURE 11.
A, intact MS of wild-type PbGH5A at 7.7 μm, expected mass, 41,649.0; found, 41,650.6. B, MS of PbGH5A at 7.7 μm and inhibitor 1 at 1.4 mm, 3-h incubation at37 °C. The peak at 42,753.3 corresponds to the mono-labeled enzyme adduct (expected mass, 42,751.7; found, 42,753.3). C, MS of PbGH5A at 7.4 μm and inhibitor 2 at 1.4 mm, 3-h incubation at 37 °C. The peak at 42,751.2 corresponds to the mono-labeled enzyme (expected mass, 42,750.7; found, 42,751.2). D, MS of the PbGH5A mutant E280A at 6.4 μm, 3-h incubation at 37 °C with 1.4 mm inhibitor 1 XXXG-NHCOCH2Br. The peak at 42,693.3 corresponds to mono-labeled protein. Expected mass, 42,693.7; found, 42,693.3.
FIGURE 12.
FIGURE 12.
Overall structure of PbGH5A. A, PbGH5A in complex with inhibitor 1. Secondary structure of PbGH5A is shown in schematic representation and color-coded with strands in green, helices in blue, and loops in yellow. Two ligand molecules, XXXG-NHCOCH2Br, are shown in ball-and-stick, in gray and black. The active site positive and negative subsites are indicated. B, asymmetric unit for the PbGH5A(E280A)·XXXGXXXG complex. Secondary structure of PbGH5A is shown in schematic representation and color-coded blue and pink for monomer A and green and pink for monomer B. Two ligand molecules are shown in ball-and-stick, in gray and black.
FIGURE 13.
FIGURE 13.
PbGH5A active site. A, stereo view of the negative subsites of XXXGXXXG complex. The ligand in the active site is in gray, in ball-and-stick, whereas PbGH5 side chains, involved in binding, are in yellow; water molecules are shown as red spheres. FoFc electron density (3σ level) is contoured in green around the ligand. The ligand in adjacent positive subsites is shown in line representation in black. B, stereo view of the positive subsites of XXXGXXXG complex. The ligand is in black ball-and-stick. The ligand shown in gray lines is bound in the negative subsites of the same monomer. The rest as in A. C, stereo view of the positive subsites of XXXG complex. The same representation as for B. D, stereo view of the positive subsites of cellotetraose complex. The same representation as for B.
FIGURE 14.
FIGURE 14.
Schematic representation of the PbGH5A active site bound to two XXXG oligosaccharide units, based on the structure of the PbGH5A in complex with the XXXGXXXG tetradecasaccharide. Key hydrogen bonds between the enzyme and the ligands are represented by dashed lines, and key stacking interactions are represented by curved lines, and the residues involved are in gray. Interactions with the solvent were omitted for visual clarity.
FIGURE 15.
FIGURE 15.
Comparison of PbGH5A complexed structures. A, overall shape of the active-site pocket and conformation of ligand binding within. Surface representation of PbGH5A complexes with ligands from the four complexes are shown superimposed. Enzyme regions in direct contact with the ligand are colored dark blue for the XXXGXXXG complex, and additional interactions are in gray for the XXXG complex and in pink for cellotetraose complex. Ligands are in ball-and-stick; in black (XXXGXXXG), in pink (XXXG-NHCOCH2Br), in orange (XXXG), and in light blue (cellotetraose). B, pairwise comparison, binding of branched ligands. Stereo view of XXXGXXXG and XXXG ligand superposition is shown in ball-and-stick, ligands are color-coded as in A. PbGH5A residues shown for orientation are in yellow, and key differences in binding are indicated by gray lines. C, pairwise comparison, binding of branched versus unbranched ligand. Stereo view of XXXG and GGGG ligand superposition is shown in ball-and-stick, and ligands color-coded as in A. PbGH5A residues shown for orientation are in yellow, and key differences in binding indicated by gray lines.
FIGURE 16.
FIGURE 16.
PbGH5A active site in complex with XXXG-NHCOCH2Br. A, negative subsites. The ligand in the active site is in gray, in ball-and-stick, and PbGH5A side chains, involved in binding are in yellow; water molecules are shown as red spheres. FoFc electron density (3.5σ level) is contoured in green around the ligand. B, positive subsites. The ligand is in black, and the residues from adjacent symmetry-related monomer are in cyan. Other coloring is as in A.
FIGURE 17.
FIGURE 17.
Comparison of GH5_4 structural homologs. A, overall shape of the active site pocket. The active sites are shown as a semi-transparent blue surface representation for six structures as follows: three MLG active enzymes PbGH5A, Xeg5A (PDB code, 4W88), and BhGH5 (PDB code, 4V2X); and three XyG-specific enzymes, Xeg5B (PDB code, 4W8B), PpXG5 (PDB code, 2JEQ), and BoGH5 (PDB code, 3ZMR). Ligands, if present, are shown in cyan ball-and-stick representation. Highlighted in red are the two catalytic glutamate residues present in all of the compared structures. Highlighted in green are two regions that contribute the most to the differences in the active-site shape between the compared structures: the narrowing at the top of the −1 subsite in MLG-active enzymes (absent in XyG-specific enzymes), and the presence of a bulky aromatic residue making up the binding platform for the −2′-xylose in XyG (absent in MLG-active enzymes). For emphasis, a white circle contours the binding surface available at the −1 and −2 subsites of the XyG-specific enzymes and points to the lack thereof for the MLG-active enzymes. B, superposition of the MLG-active enzymes from A. For clarity, only the secondary structure of PbGH5A is shown. The loops making up the active site are shown in cyan (top four loops) and blue (bottom three loops). Shown in ball-and-stick are the residues responsible for the unique shape of the active site: top acidic residues narrowing the −1 subsite and the bottom His residue forming the −2′ subsite. PbGH5A residues are in green, Xeg5A in gray, and BhGH5 in wheat. For general orientation, the XXXGXXXG ligand in PbGH5A structure is shown in line representation. C, comparison between PbGH5A and XyG-specific enzymes. The representation is the same as in B. Distinct residues in the −1 and −2′-subsites are in the following color code: PbGH5A, green; BoGH5, orange; Xeg5B, violet; PpGH5, pink.

References

    1. Albersheim P., Darvill A., Roberts K., Sederoff R., and Staehelin A. (2010) Plant Cell Walls, pp. 1–363, Garland Science, New York
    1. Fry S. C. (1989) The structure and functions of xyloglucan. J. Exp. Bot. 40, 1–11
    1. Hayashi T. (1989) Xyloglucans in the primary cell wall. Annu. Rev. Plant Physiol. Plant Mol. Biol. 40, 139–168
    1. Fry S. C., Nesselrode B. H., Miller J. G., and Mewburn B. R. (2008) Mixed-linkage (1→3,1→4)-β-d-glucan is a major hemicellulose of Equisetum (horsetail) cell walls. New Phytologist 179, 104–115 - PubMed
    1. Xue X., and Fry S. C. (2012) Evolution of mixed-linkage (1 → 3, 1 → 4)-β-d-glucan (MLG) and xyloglucan in Equisetum (horsetails) and other monilophytes. Ann. Bot. 109, 873–886 - PMC - PubMed

Publication types

MeSH terms

LinkOut - more resources