. 2013 Jul 3;135(26):9723-32.
doi: 10.1021/ja4014375. Epub 2013 Jun 25.

Engineering hydrophobic protein-carbohydrate interactions to fine-tune monoclonal antibodies

Affiliations

Engineering hydrophobic protein-carbohydrate interactions to fine-tune monoclonal antibodies

Xiaojie Yu et al. J Am Chem Soc. .

Abstract

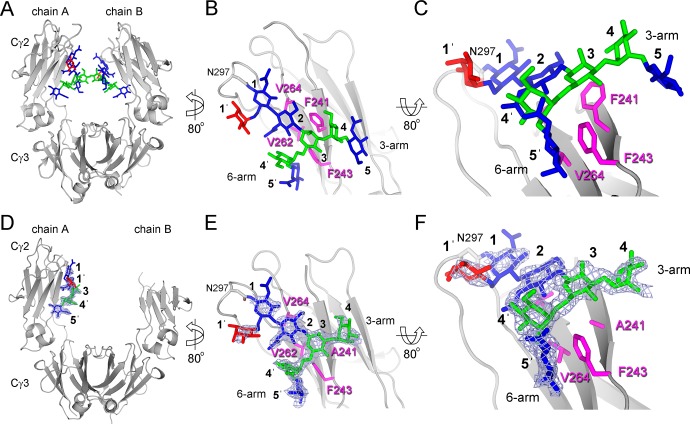
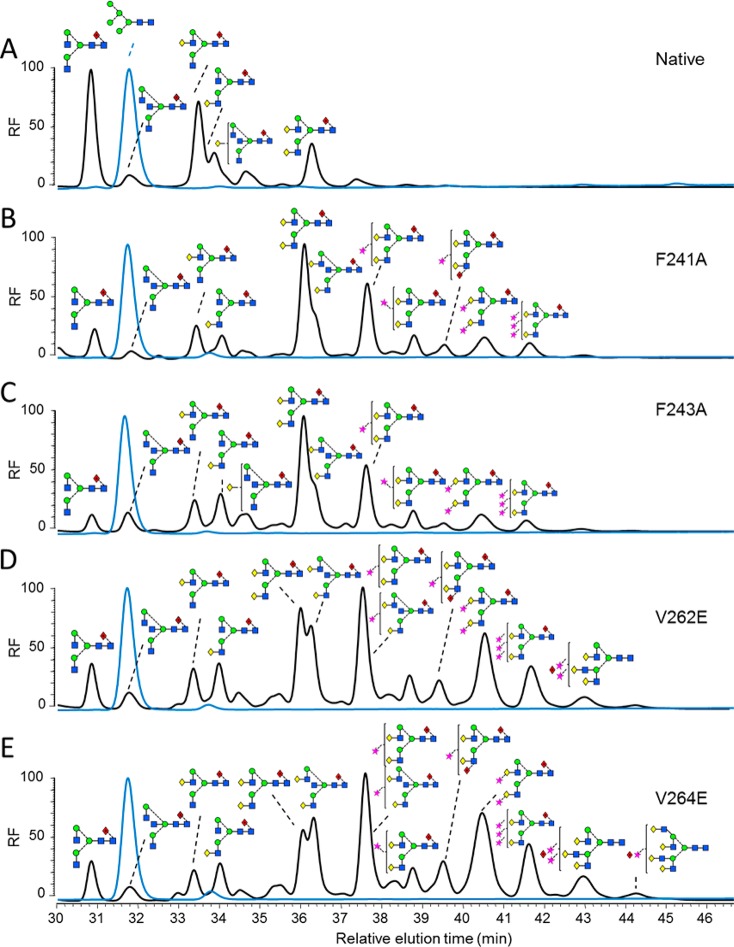
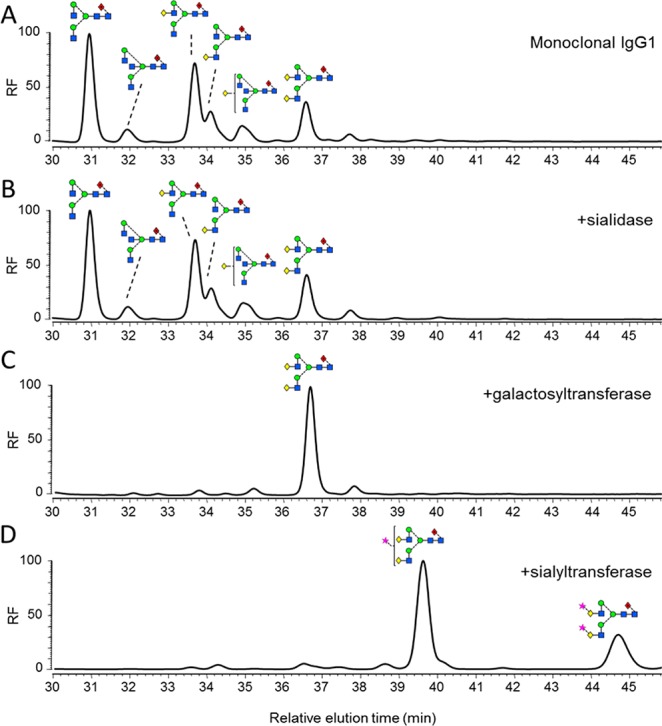
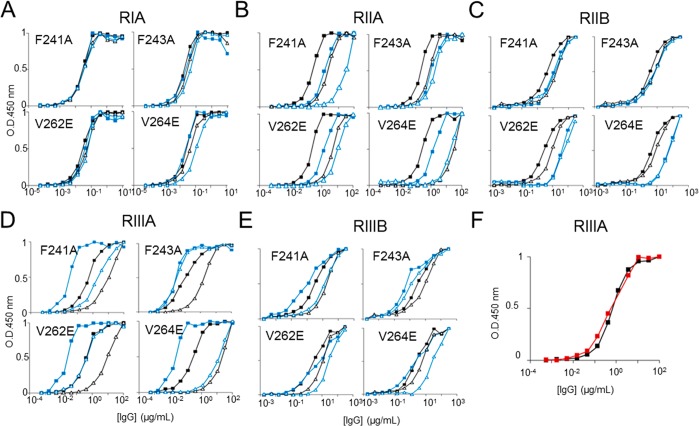
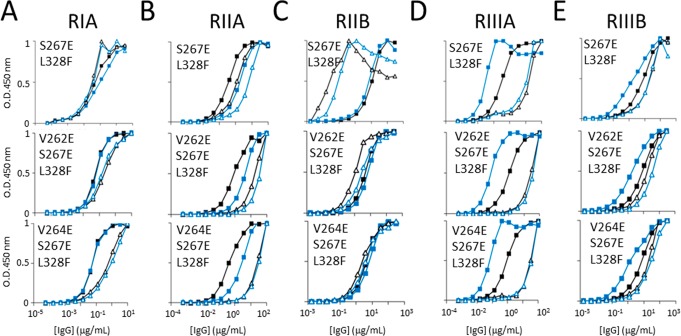
Biologically active conformations of the IgG1 Fc homodimer are maintained by multiple hydrophobic interactions between the protein surface and the N-glycan. The Fc glycan modulates biological effector functions, including antibody-dependent cellular cytotoxicity (ADCC) which is mediated in part through the activatory Fc receptor, FcγRIIIA. Consistent with previous reports, we found that site-directed mutations disrupting the protein-carbohydrate interface (F241A, F243A, V262E, and V264E) increased galactosylation and sialylation of the Fc and, concomitantly, reduced the affinity for FcγRIIIA. We rationalized this effect by crystallographic analysis of the IgG1 Fc F241A mutant, determined here to a resolution of 1.9 Å, which revealed localized destabilization of this glycan-protein interface. Given that sialylation of Fc glycans decreases ADCC, one explanation for the effect of these mutants on FcγRIIIA binding is their increased sialylation. However, a glycan-engineered IgG1 with hypergalactosylated and hypersialylated glycans exhibited unchanged binding affinity to FcγRIIIA. Moreover, when we expressed these mutants as a chemically uniform (Man5GlcNAc2) glycoform, the individual effect of each mutation on FcγRIIIA affinity was preserved. This effect was broadly recapitulated for other Fc receptors (FcγRI, FcγRIIA, FcγRIIB, and FcγRIIIB). These data indicate that destabilization of the glycan-protein interactions, rather than increased galactosylation and sialylation, modifies the Fc conformation(s) relevant for FcγR binding. Engineering of the protein-carbohydrate interface thus provides an independent parameter in the engineering of Fc effector functions and a route to the synthesis of new classes of Fc domain with novel combinations of affinities for activatory and inhibitory Fc receptors.


Figures

Figure 1
Figure 1
Mass spectrometric analysis of N-glycans released from IgG Fc-F241A. (A) Negative ion ESI spectrum. (B) The data from panel A were processed with the maximum entropy 3 function of MassLynx to convert multiply charged ions to singly charged ions. The position of the fucose residue in the triantennary glycans was not determined. The ion at m/z 3169 gave a composition corresponding to the tetrasialylated triantennary glycan, but this was not confirmed by fragmentation. (C) An example of negative ion collision-induced dissociation spectrum of the monosialylated, fucosylated biantennary glycan. Fragment ions are labeled according to the scheme devised by Domon and Costello. (D) Spectra showing trigalactosylated structures with three (triply charged) and four (quadruply charged) sialic acids attached, respectively. Key: Integrated oligosaccharide nomenclature follows that of Bowden et al. Residue labeling follows that of Vliegenhart et al. with the additional modifications of 7 for sialic acid, 1′ for α1→6-linked core fucose. These residue labels are in bold face throughout the manuscript. The symbolic representation of glycans follows that of Harvey et al. with residues in both the schematic diagrams and molecular graphics following the color scheme of the Consortium for Functional Glycomics.
Figure 2
Figure 2
Packing of N-link glycans in native (A–C) and F241A mutant (D–F) IgG Fc. Glycans are displayed as blue (GlcNAc), red (Fuc), and green (Man) sticks. Protein is displayed as a gray cartoon with four hydrophobic residues at the protein–glycan interface highlighted in pink (sticks). Overall structure of (A) native (PDB ID 3AVE) and (B) F241A mutant IgG1 Fc. The Cγ2 domains from chain A (B and E) are shown with close-ups of the protein-glycan interfaces (C and F). Four hydrophobic residues located on the protein–glycan interface are highlighted in pink (sticks). Electron density corresponding to carbohydrate is depicted as a blue mesh (2FoFc map contoured at 1σ) around the carbohydrate moiety of the mutant Fc reported herein. Integrated oligosaccharide nomenclature follows that of Bowden et al., see legend to Figure 1 for further details. Secondary structure was defined by Ksdssp.
Figure 3
Figure 3
HPLC analysis of 2AA-labeled N-linked glycans from monoclonal IgG1 b12 mutants expressed in HEK 293T and HEK 293S cells. Normal-phase HPLC analysis of 2-AA-labeled N-linked glycans released from target antibody glycoforms by in-gel protein PNGase F digestion. Glycan profile of IgG1 b12 expressed in HEK 293T (black) and HEK 293S (blue) for the following variants: (A) wild type; (B) F241A; (C) F243A; (D) V262E; and (E) V264E. The y-axis displays relative fluorescence (RF).
Figure 4
Figure 4
Generation of differentially glycosylated IgG1 Fc. Normal-phase HPLC analysis of 2-AA-labeled N-linked glycans, released from target antibody glycoforms by in-gel PNGase F digestion. (A) Glycan profile of monoclonal IgG1 b12. (B) Glycan profile of IgG1 incubated with 50 U/mL Clostridium perfringens neuraminidase for 48 h at 37 °C. (C) Glycan profile of IgG1 incubated with 25 μg/mL β1,4-galactosyltransferase (B4GALTI) and 80 μM uridine 5′-diphosphogalactose in 50 mM HEPES, 10 mM MnCl2, pH 7.5 for 48 h at 37 °C. (D) Glycan profile of IgG1 sequentially treated with B4GALTI and α2,6-sialyltransferase I (ST6GALI) as described above.
Figure 5
Figure 5
ELISA of monoclonal IgG variants binding human FcγRIA, FcγRIIA, FcγRIIB, FcγRIIIA, and FcγRIIIB. The FcγRs were plated at 5 μg/mL overnight at 4 °C, IgG variants F241A, F243A, V262E, and V264E were incubated for 1.5 h, and binding was detected by HRP-conjugated goat antihuman Fab antibody. Symbolic representation of IgG mutation and glycovariants: solid black square = wild-type native; solid blue square = wild-type Man5GlcNAc2; open black triangle = mutant native; open blue triangle = mutant Man5GlcNAc2; solid red square = wild-type hypergalactosylated and hypersialylated, ELISA binding curves of the four IgG hydrophobic mutants for (A) FcγRIA, IgG variant starting concentration at 10 μg/mL. (B) FcγRIIA, IgG variant starting concentration at 100 μg/mL. (C) FcγRIIB, IgG variant starting concentration at 300 μg/mL. (D) FcγRIIIA, IgG variant starting concentration at 100 μg/mL. (E) FcγRIIIB, IgG variant starting concentration at 300 μg/mL. (F) FcγRIIIA, IgG variant starting concentration at 100 μg/mL. All data points represent the calculated mean of two independent measurements from a total of at least two experiments.
Figure 6
Figure 6
ELISA of monoclonal IgG variants binding human FcγRIA, FcγRIIA, FcγRIIB, FcγRIIIA and FcγRIIIB. The FcγRs were plated at 5 μg/mL overnight at 4 °C, IgG variants S267E/L328F, V262E/S267E/L328F, and V264E/S267E/L328F were incubated for 1.5 h and binding was detected by HRP-conjugated goat antihuman Fab antibody. Symbolic representation of IgG mutation and glycovariants: solid black square = wild-type native; solid blue square = wild-type Man5GlcNAc2; open black triangle = mutant native; open blue triangle = mutant Man5GlcNAc2, ELISA binding curves of the four IgG hydrophobic mutants for (A) FcγRIA, IgG variant starting concentration at 10 μg/mL. (B) FcγRIIA, IgG variant starting concentration at 100 μg/mL. (C) FcγRIIB, IgG variant starting concentration at 300 μg/mL. (D) FcγRIIIA, IgG variant starting concentration at 100 μg/mL. (E) FcγRIIIB, IgG variant starting concentration at 300 μg/mL. All data points represent the calculated mean of two independent measurements from a total of at least two experiments.
Figure 7
Figure 7
SPR analysis of monoclonal IgG variants binding to human FcγRIIIA. The human FcγRIIIA was immobilized on the CM5 sensorchip by amine coupling. The IgG variants were injected at 5 different concentrations at a flow rate of 30 μL/min: IgG and IgG hypersialylated (0.67, 0.33, 0.17, 0.083, and 0.042 μM); IgG Man5GlcNAc2 (0.33, 0.17, 0.083, 0.042, and 0.021 μM). The association time was 2 min, and dissociation time was 3 min. The chip was regenerated with 10 mM glycine-HCl, pH 1.7. Sensorgrams were fitted with a global 1:1 interaction, and the ka, kd, and KD were calculated, all using BIA evaluation software 2.0.3. KD values are reported as mean ± SD, and sensorgrams are representative a total of three independent experiments.

References

    1. Nimmerjahn F.; Ravetch J. V. Annu. Rev. Immunol. 2008, 26, 513. - PubMed
    1. Ravetch J. V.; Bolland S. Annu. Rev. Immunol. 2001, 19, 275. - PubMed
    1. Krapp S.; Mimura Y.; Jefferis R.; Huber R.; Sondermann P. J. Mol. Biol. 2003, 325, 979. - PubMed
    1. Deisenhofer J. Biochemistry 1981, 20, 2361. - PubMed
    1. Borrok M. J.; Jung S. T.; Kang T. H.; Monzingo A. F.; Georgiou G. ACS Chem. Biol. 2012, 7, 1596. - PMC - PubMed

Publication types

MeSH terms

Associated data