. 2012 Sep 14;422(2):245-62.
doi: 10.1016/j.jmb.2012.05.029. Epub 2012 May 30.

Structure-guided directed evolution of highly selective p450-based magnetic resonance imaging sensors for dopamine and serotonin

Affiliations

Structure-guided directed evolution of highly selective p450-based magnetic resonance imaging sensors for dopamine and serotonin

Eric M Brustad et al. J Mol Biol. .

Abstract

New tools that allow dynamic visualization of molecular neural events are important for studying the basis of brain activity and disease. Sensors that permit ligand-sensitive magnetic resonance imaging (MRI) are useful reagents due to the noninvasive nature and good temporal and spatial resolution of MR methods. Paramagnetic metalloproteins can be effective MRI sensors due to the selectivity imparted by the protein active site and the ability to tune protein properties using techniques such as directed evolution. Here, we show that structure-guided directed evolution of the active site of the cytochrome P450-BM3 heme domain produces highly selective MRI probes with submicromolar affinities for small molecules. We report a new, high-affinity dopamine sensor as well as the first MRI reporter for serotonin, with which we demonstrate quantification of neurotransmitter release in vitro. We also present a detailed structural analysis of evolved cytochrome P450-BM3 heme domain lineages to systematically dissect the molecular basis of neurotransmitter binding affinity, selectivity, and enhanced MRI contrast activity in these engineered proteins.


Figures

Figure 1
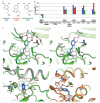
Figure 1. Directed evolution and structural characterization of broadly specific DA sensors
(a) Structures of dopamine (DA), serotonin (5HT) and norepinephrine (NE). (b) Color-coded bar graphs show affinity constants (Ka) for DA, 5HT and NE of error-prone PCR BM3h-B7 lineage from Ref. 12. Bars correspond to: DA (blue, left), 5HT (red, middle) and NE (green, right). We have set the Y-axis in units of log(mM−1); for reference to table 1, the 0 axis would correspond to a dissociation constant (Kd) of 1 mM. Bar graphs descending below the 0 axis indicate dissociation constants that exceed 1 mM. Residues located in the active site of BM3h are marked (*). Mutations identified by ** were included to improve protein stability. Errors for Ka bar graphs are reported as standard deviations determined from a minimum of three independent experiments. (c) DA (blue) bound to BM3h-8C8 (green). Waters are shown as red spheres and dashed lines indicate hydrogen bonds. The exocyclic hydroxyls of DA form hydrogen bonds to the backbone carbonyl of A330. (d) Active site alignment of BM3h-8C8 + DA (green) and wild type BM3h (grey, from PDB:2IJ2). Mutation at L75P allows movement of F81 to accommodate the DA ring (blue). (e) Rotation of the I-helix (shown by arrow) due to mutation at T268A. An alignment of the wild type (grey) and BM3h-8C8 + DA (green) is shown. A dashed line marks the wild type hydrogen bond between the side-chain of T268 and the backbone carbonyl of A264. The rotation of the I-helix can be readily observed by comparing the Cα positions of wild type I263 and I263A in BM3h-8C8. (f) Large scale movements in the B’-Helix upon mutation of F81 in the BM3h-8C8 (green) to leucine in BM3h-B7 (orange). BM3h-B7 bound DA is shown in blue.
Figure 2
Figure 2. Shared binding modalities in broadly specific DA/5HT binder BM3h-8C8
(a) BM3h-8C8 bound 5HT (purple) shares interactions that are used for DA binding modes observed in fig. 1. The exocyclic hydroxyl forms a hydrogen bond with the backbone carbonyl of A330 as well as an existing water network. The indole nitrogen forms a hydrogen bond to the backbone carbonyl of L437. Hydrogen bonds are shown by dashed lines and waters by red spheres. (b) The aromatic rings of 5HT and DA point into the same binding pocket towards A330. 5HT is shown in purple overlaid with DA, shown in blue. In both cases the neurotransmitter amine coordinates the heme iron center.
Figure 3
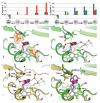
Figure 3. Directed evolution and structural characterization of highly specific 5HT and DA sensors
(a-b) Color-coded bar graphs show affinity constants (Ka) for DA, 5HT and NE as described in fig. 1. (a) 5HT-selective BM3h-2G9C6 lineage evolved using active site-directed libraries. (b) DA-selective BM3h-9D7 lineage evolved using active site-directed libraries. (c) 5HT (dark red) bound to BM3h-2G9 (green backbone). Active site mutations F87L and T438L (orange), shown as sticks and van der Waals spheres, provide the hydrophobic packing core that sandwiches the 5HT ligand. T268S is also shown; deletion of the Cγ methyl group accommodates the 5HT ethylamine moiety. (d) A network of waters connects the 5HT exocyclic hydroxyl and the side-chain of T268S. A 2nd network of waters links the indole nitrogen and the propionic acid side-chain of the heme. (e) Crystal structure of BM3h-2G9C6 (gold) bound to 5HT (pink). A slight rotation in the bound 5HT compared to BM3h-2G9 (transparent ligand) is observed as a result of the L437Q mutation. An extensive water hydrogen bonding network linking L437Q and 5HT is also shown (red spheres and dashed lines). Arrows indicate 2 of the 3 main solvent channels in BM3h. (f) A comparison of 5HT orientations in broadly specific BM3h-8C8 (green protein, purple 5HT) and BM3h-2G9C6 (gold protein, pink 5HT). 5HT occupies an alternative pocket within the BM3h active site in 5HT-selective BM3h-2G9C6. In panels b and d, waters are shown as red spheres and dashed lines indicate hydrogen bonds. Errors for Ka bar graphs are reported as standard deviations determined from a minimum of three independent experiments.
Figure 4
Figure 4. BM3h-2G9C6 is a sensor for secreted 5HT in cell culture
(a) RBL-2H3 cells secrete 5HT in response to increases in intracellular Ca2+ concentration (e.g. by treatment with ionomycin), which can then be observed by T1-weighted MRI of aspirated treatment medium mixed with purified BM3h protein in microtiter plate wells. The image illustrates an example contrast-adjusted T1-weighted spin echo scan (TE = 10 ms, TR = 1221 ms) of a 2-mm slice of microtiter wells containing, left, DMSO-treated cell supernatant or, right, ionomycin-treated cell supernatant, both mixed with BM3h-2G9C6 to a final concentration of 50 μM. (b) Estimates of absolute 5HT concentration in aspirated treatment medium from 80 – 90% confluent 75-cm2 flasks 15 minutes after treatment with Locke’s buffer containing either 0.1% (v/v) DMSO or 2.5 μM ionomycin. Briefly, clarified supernatant was either mixed with purified BM3h-2G9C6 and observed by T1-weighted MRI or assayed for 5HT content using a commercial colorimetric ELISA kit. (c) Aliquots of the same samples as in (b) were imaged by MRI after addition of 50 μM BM3h wild type (WT) or BM3h-2G9C6 protein. Longitudinal relaxation rates (R1) of BM3h-containing samples are expressed as −ΔR1/R1,0 = (R1,0 - R1,15)/R1,0 × 100%, where R1,0 and R1,15 are the relaxation rates of Locke’s buffer containing BM3h protein and either DMSO or 2.5 μM ionomycin before or after 15 minutes of exposure to cells, respectively. Errors are reported as standard deviations determined from a minimum of three independent experiments.
Fig. 5
Fig. 5. Alternative dopamine binding in BM3h-9D7
(a) Active site alignment of BM3h-9D7 + DA (teal) and wild type BM3h (grey, from PDB:2IJ2) shows no change in F87 orientation. (b) Active site alignment of BM3h-8C8 + DA (green) and BM3h-9D7 + DA (teal). Differences in DA ligand orientation are due to mutations at L75P (BM3h-8C8) or A330G (BM3h-9D7), which allow improved packing of F87 against the DA catechol ring. Residue identities in parentheses represent mutations that differ in BM3h-9D7 and BM3h-8C8.

References

    1. Fukunaga M, et al. Layer-specific variation of iron content in cerebral cortex as a source of MRI contrast. Proc. Natl. Acad. Sci. USA. 2010;107:3834–3839. - PMC - PubMed
    1. Ahrens ET, Genove G, DeMarco U, Xu HY, Goins WF. A new transgene reporter for in vivo magnetic resonance imaging. Nat. Med. 2005;11:450–454. - PubMed
    1. Cohen B. MRI detection of transcriptional regulation of gene expression in transgenic mice. Nat. Med. 2007;13:498–503. - PubMed
    1. Lelyveld VS, Atanasijevic T, Jasanoff A. Challenges for Molecular Neuroimaging with MRI. Int. J. Imag. Syst. Tech. 2010;20:71–79. - PMC - PubMed
    1. Ogawa S, Lee TM, Kay AR, Tank DW. Brain magnetic resonance imaging with contrast dependent on blood oxygenation. Proc. Natl. Acad. Sci. USA. 1990;87:9868–9872. - PMC - PubMed

Publication types