. 2013 Feb 14;152(4):755-67.
doi: 10.1016/j.cell.2012.12.042.

Structural basis for recruitment and activation of the AP-1 clathrin adaptor complex by Arf1

Affiliations

Structural basis for recruitment and activation of the AP-1 clathrin adaptor complex by Arf1

Xuefeng Ren et al. Cell. .

Abstract

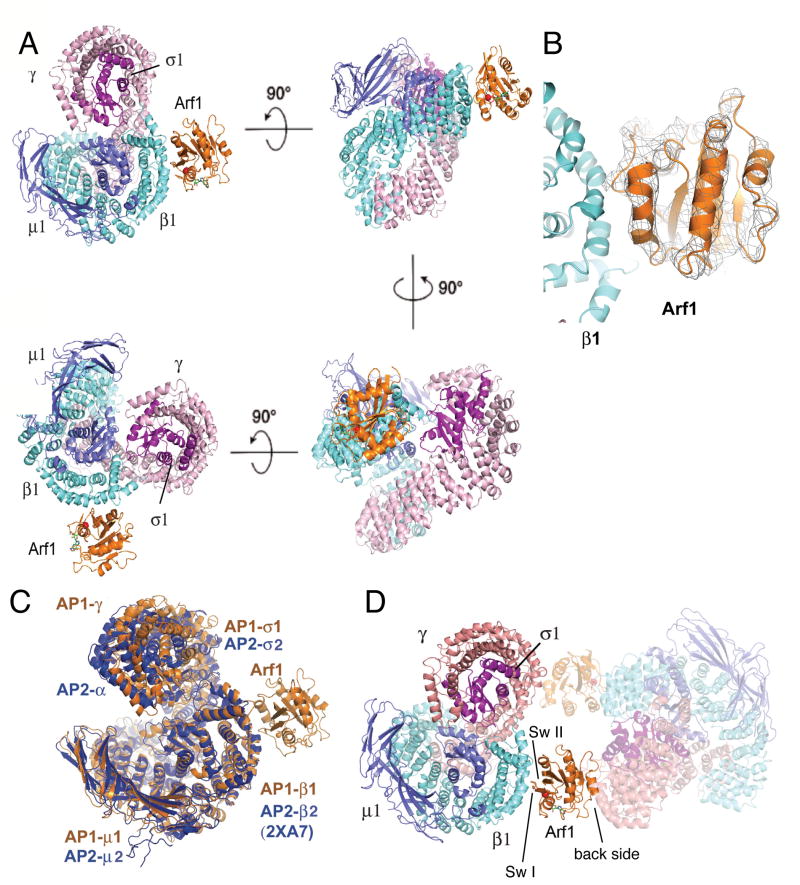
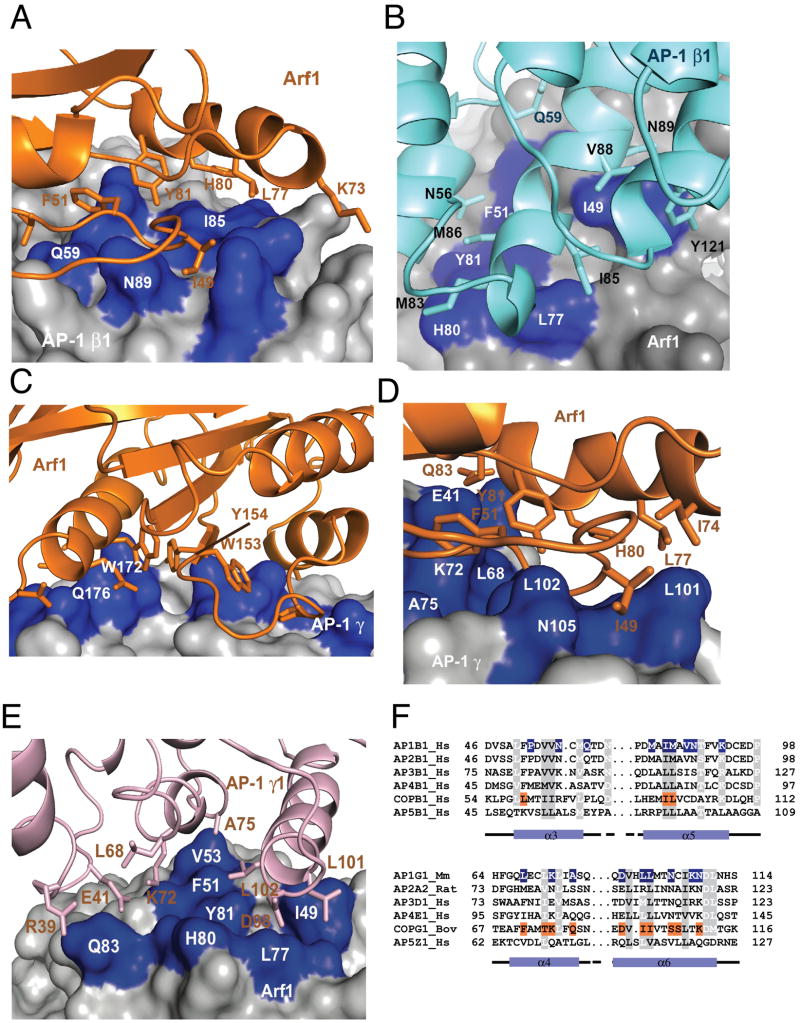
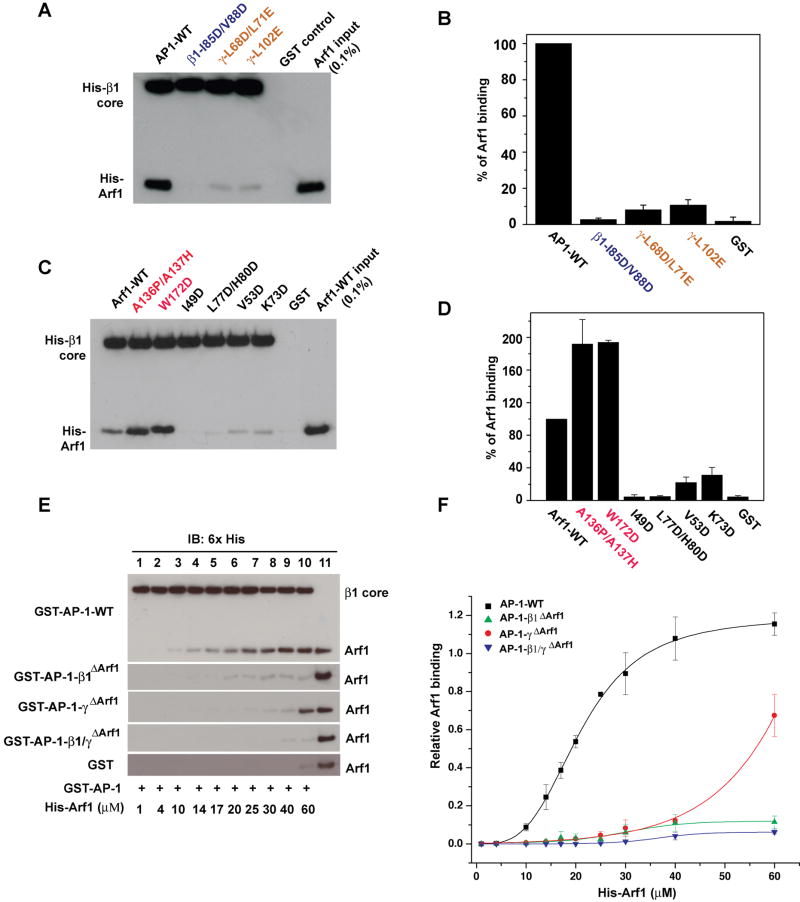
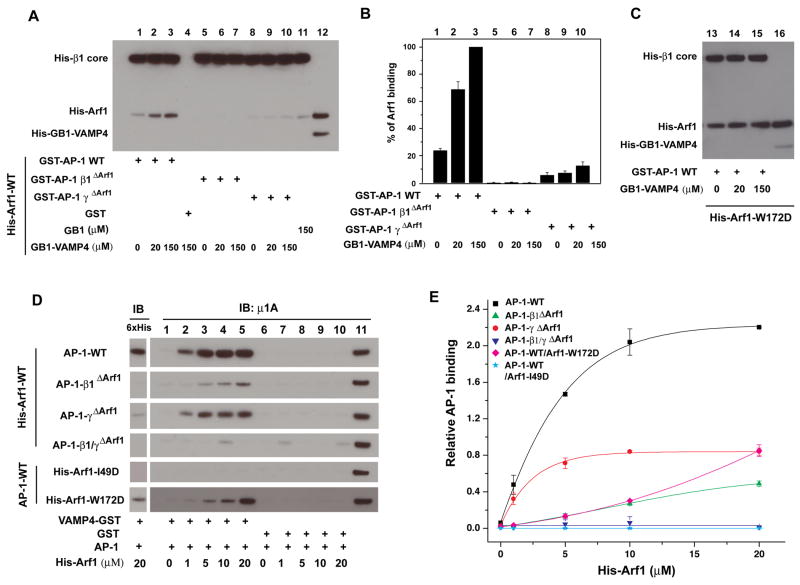
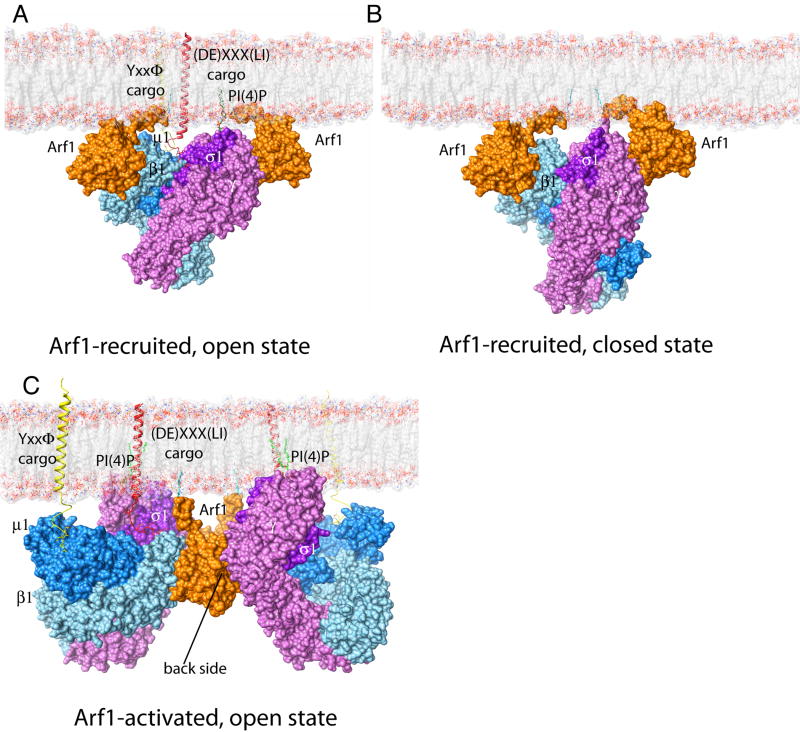
AP-1 is a clathrin adaptor complex that sorts cargo between the trans-Golgi network and endosomes. AP-1 recruitment to these compartments requires Arf1-GTP. The crystal structure of the tetrameric core of AP-1 in complex with Arf1-GTP, together with biochemical analyses, shows that Arf1 activates cargo binding by unlocking AP-1. Unlocking is driven by two molecules of Arf1 that bridge two copies of AP-1 at two interaction sites. The GTP-dependent switch I and II regions of Arf1 bind to the N terminus of the β1 subunit of one AP-1 complex, while the back side of Arf1 binds to the central part of the γ subunit trunk of a second AP-1 complex. A third Arf1 interaction site near the N terminus of the γ subunit is important for recruitment, but not activation. These observations lead to a model for the recruitment and activation of AP-1 by Arf1.


Figures

Figure 1
Figure 1. Crystal structure of the AP-1:Arf1 complex
(A) Views of the overall structure of the AP-1 Arf1 complex, related by rotations about the indicated axes. Colors are γ, light pink; β1, aquamarine; μ1, slate blue; σ1, purple; and Arf1, orange. (B) Unbiased difference density contoured at 2σ around Arf1, which was not present in the search model used to obtain these phases, illustrates the high quality of the molecular replacement phases at 7 Å. (D) Overlay of the YXXØ cargo-bound conformation of AP-2 upon Arf1-GTP-bound AP-1. (E) Overall structure of the crystallographic dimer. See also Table S1.
Figure 2
Figure 2. Arf1 interfaces with AP-1 subunits
(A) Arf1 is shown in a ribbon model (orange) as it interacts with the surface of the β1 subunit. Functionally important residues of β1 are highlighted in blue. (B) The same interface shown in (A) is represented with a ribbon model of the β1 subunit and a surface representation of Arf1, with key switch I and II residues of Arf1 highlighted in blue. (C) The back side of Arf1 distal to switch I and II is shown in a ribbon model (orange) as it interacts with the surface of the γ subunit in the crystal. Interacting residues of γ are highlighted in blue. (D, E) Two views of the functional Arf1 interface with the γ subunit. This interface is not present in this crystal structure, but is modeled on the basis of the β1 interface and by analogy to the COPI complex (Yu et al., 2012), represented as in (A, B). (F) Structure-based alignment of key Arf1 switch I and II-binding helices of the β1 and γ subunits of AP-1 with corresponding subunits of other AP complexes and COPI. See also Fig. S1.
Figure 3
Figure 3. Mutational analysis of Arf1 binding sites
(A, B) Representative gel (A) and quantification (B) of GST pull-down assays to assess binding of the immobilized GST-AP-1 core and its mutants to Arf1-GTP. GST-AP-1 core proteins (15μg) were immobilized on glutathione-Sepharose beads and incubated with His-Arf1Δ16-Q71L (5 μM). The AP-1-bound Arf1 was detected by anti-His-tag antibody using Western blotting. (C, D) The same procedures as in (A) were used to determine the effects of switch I (I49D, V53D), switch II (K73D, L77D/H80D), and back side (A136P/A137H, W172D) mutations in Arf1 on binding to the wild-type AP-1 core. (E, F) Arf1-AP1 binding curves derived from quantitative immunoblotting. Lane 11 in (E) represents 1.6 pmol of His-Arf1 input, which was used for normalization. Relative Arf1 binding was quantified and fitted to the Hill equation in (F). See also Fig. S2 and S3. Error bars represent the standard deviation of three measurements.
Figure 4
Figure 4. Arf1-binding sites on β1 and γ are required for association of AP-1 to the TGN/endosomes
(A, B) MDCK-μ1A-HA cells transfected with plasmids encoding β1WT-GFP or β1ΔArf1-GFP (A) and γWT-GFP or γΔArf1-GFP (B) or GFP (A, B) were subjected to immunoprecipitation (IP) with antibody to GFP followed by SDS-PAGE and immunoblotting with HRP-conjugated antibodies to the HA epitope and GFP. The position of molecular mass markers (in kDa) are indicated on the left. Loading was adjusted to normalize for β1 and γ expression. Assembly of β1 and γ mutants with μ1A-HA was 99±6% and 97±5% of the corresponding wild-type proteins (n=3). (C-H) HeLa cells transfected with plasmids encoding β1WT-GFP (C-E) or β1ΔArf1-GFP (F-H) were immunostained for endogenous γ. (I-N) HeLa cells were co-transfected with plasmids encoding γWT-mCh (I-K) or γΔArf1-mCh (L-N) together with μ1A-GFP. Nuclei were stained with DAPI. Images were obtained by confocal microscopy. The third image in each row is a merge of images in the green, red and blue channels. Scale bar: 10 μm.
Figure 5
Figure 5. Allosteric coupling between the Arf1 and dileucine binding sites
(A) Pull-down of Arf1 with GST-AP-1 cores in the presence of VAMP4 peptide. Wild-type or mutant GST-AP-1 core (100 nM) was immobilized, and incubated with His-Arf1-Q71L (4 μM) and 2 mM GTP and the indicated concentrations of His-GB1 tagged VAMP4 (20-28, the dileucine motif). AP-1-bound Arf1 was analyzed by the western blot using anti-polyHis antibody, followed by quantification (B) Lane 12 and lane 16 represent 0.1% of the input from the reaction containing 4 μM His-tagged Arf1 and 150 mM His-GB1-VAMP4 peptide. (C) Arf1-W172D tightly bound to GST-AP1-A core independent of the VAMP4 peptide. (D). Recruitment of AP-1 cores to VAMP4-GST was activated by Arf1, dependent on and intact AP-1 β1 Arf1 binding site. In each reaction, VAMP4 (1-51)-GST (100 nM) was immobilized and incubated with the indicated AP-1 core (0.5 μM) and His-Arf1. The bound fraction was immunoblotted using anti-polyHis to detect Arf1 (left panel) and anti-μ1 to detect AP-1 (right panel). Lane 11 represents 0.1 pmol of AP-1 core input. The relative AP-1 binding was quantified (E) to plot with the function of His-Arf1 input concentration. The active affinity of AP-1 core WT binding to his-Arf1 in the presence of VAMP4-GST was 4.0 ± 0.3 μM. Error bars represent the standard deviation of three measurements. See also Movie S1.
Figure 6
Figure 6. AP-1 recruitment and activation at the membrane
Models. (A) A model of AP-1 recruited by two myristoylated Arf1-GTP molecules, in cooperation with PI(4)P on a membrane. The Y- and LL-bearing cargos further bind and stabilize AP-1. (B) The closed conformation of AP-1 is sterically compatible with the simultaneous binding of Arf1 to β1 and to the recruitment site on γ. Therefore, the docking of AP-1 to a membrane via the simultaneous binding to these two Arf1 molecules does not, by itself, appear to be sufficient for activation. (C) The crystallized AP-1 Arf1 dimer can be docked onto a cargo bearing membrane such that the Arf1 myristate moieties, the ends of transmembrane helices of cargo proteins, and PI(4)P all lie in the plane of the membrane surface. See supplmental figure 4
Figure 7
Figure 7. Reconstitution of membrane recruitment and activation by Arf1 and cargo
(A) Recruitment of the AP-1 core to peptidoliposomes by lipid sedimentation assay. Liposomes were made of 5% DOGS-NTA:POPC:POPE, 1% VAMP4-LL/AA lipopeptide, 1% VAMP4 (1-51) lipopeptide, 5% PI(4)P, or both PI(4)P and VAMP4 lipopeptide. AP-1 cores (20 nM) were incubated with or without His-Arf1-GTP (50 nM) ultracentrifuged to separate the pellet (P) and supernatant fractions (S). Fractions were immunoblotted with anti-μ1 (A), and quantified using ImageJ. The AP-1 membrane binding percentage was calculated according to the formula (P/P+S) × 100% (B) Quantification of sedimentation data. Assays containing Arf1 are colored code in blue and without Arf1 in red. The error bars represent the standard deviation of three replicates.

References

    1. Amor JC, Harrison DH, Kahn RA, Ringe D. Structure of the human ADP-ribosylation factor-1 complexed with GDP. Nature. 1994;372:704–708. - PubMed
    1. Austin C, Boehm M, Tooze SA. Site-specific cross-linking reveals a differential direct interaction of class 1, 2, and 3 ADP-ribosylation factors with adaptor protein complexes 1 and 3. Biochemistry. 2002;41:4669–4677. - PubMed
    1. Boehm M, Aguilar RC, Bonifacino JS. Functional and physical interactions of the adaptor protein complex AP-4 with ADP-ribosylation factors (ARFs) EMBO J. 2001;20:6265–6276. - PMC - PubMed
    1. Boll W, Ohno H, Zhou SY, Rapoport I, Cantley LC, Bonifacino JS, Kirchhausen T. Sequence requirements for the recognition of tyrosine-based endocytic signals by clathrin AP-2 complexes. EMBO J. 1996;15:5789–5795. - PMC - PubMed
    1. Brodsky FM, Chen CY, Knuehl C, Towler MC, Wakeham DE. Biological basket weaving: Formation and function of clathrin- coated vesicles. Annu Rev Cell Dev Biol. 2001;17:517–568. - PubMed

Publication types

Associated data