. 2013 Sep 17;52(37):6396-411.
doi: 10.1021/bi400795e. Epub 2013 Sep 6.

Allostery and substrate channeling in the tryptophan synthase bienzyme complex: evidence for two subunit conformations and four quaternary states

Affiliations

Allostery and substrate channeling in the tryptophan synthase bienzyme complex: evidence for two subunit conformations and four quaternary states

Dimitri Niks et al. Biochemistry. .

Abstract

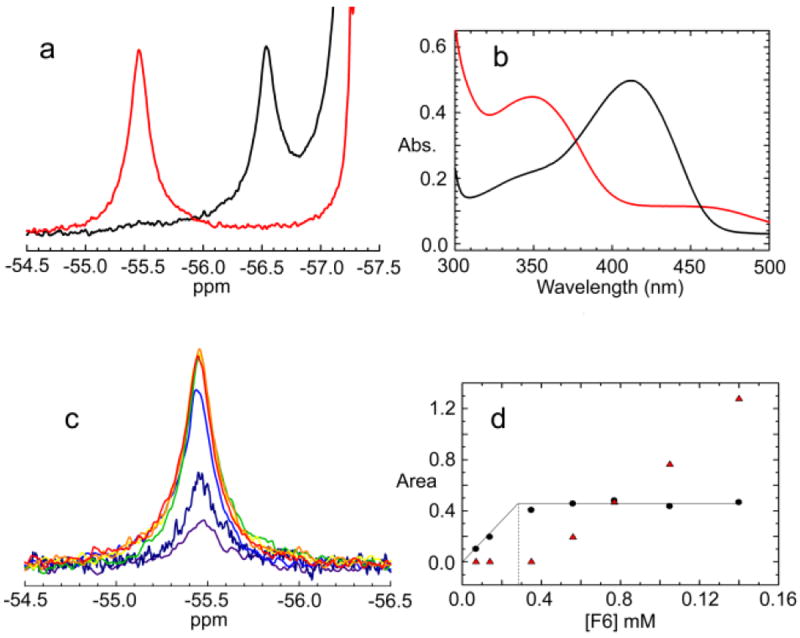
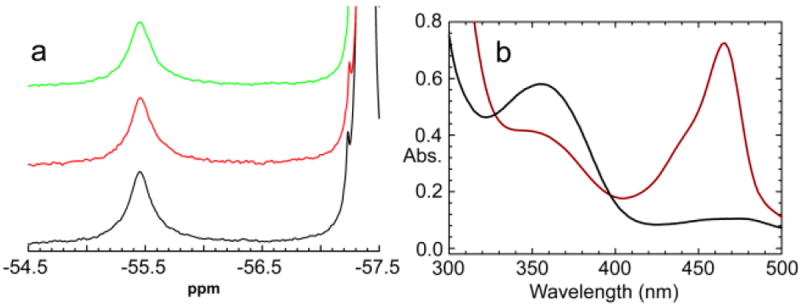
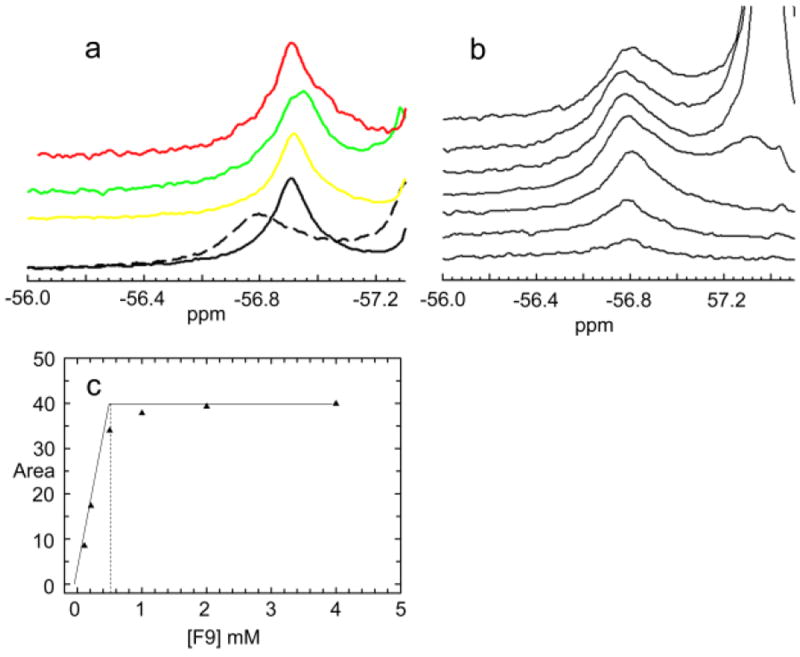
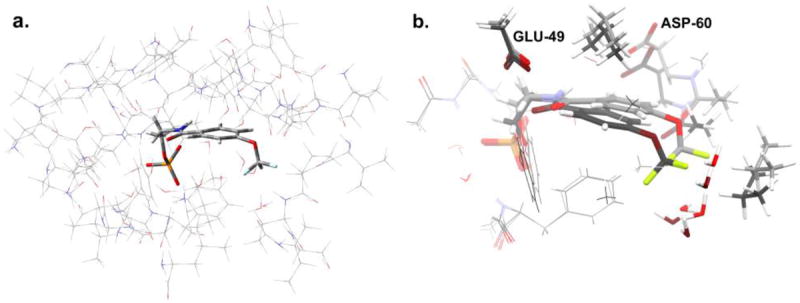
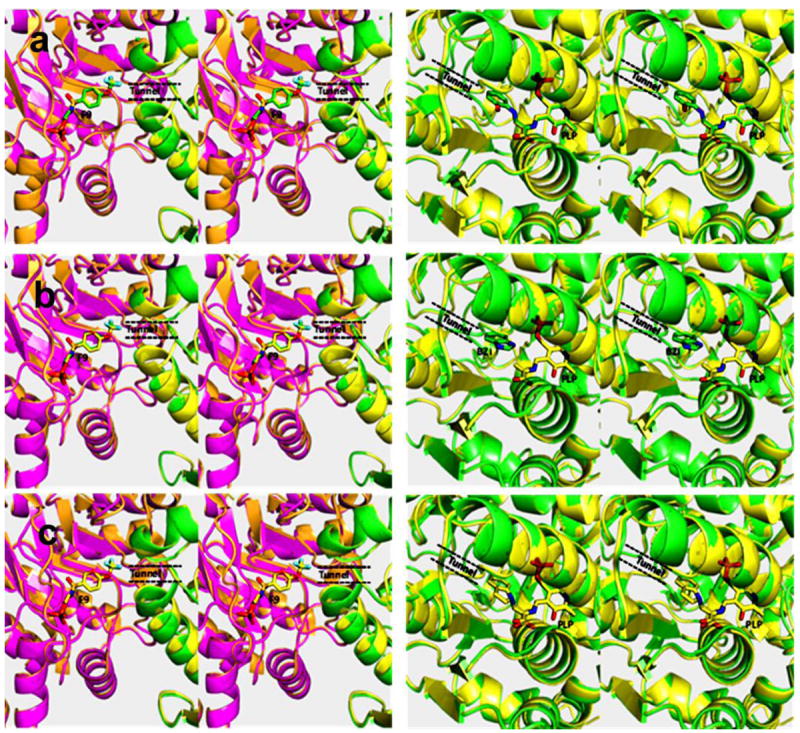
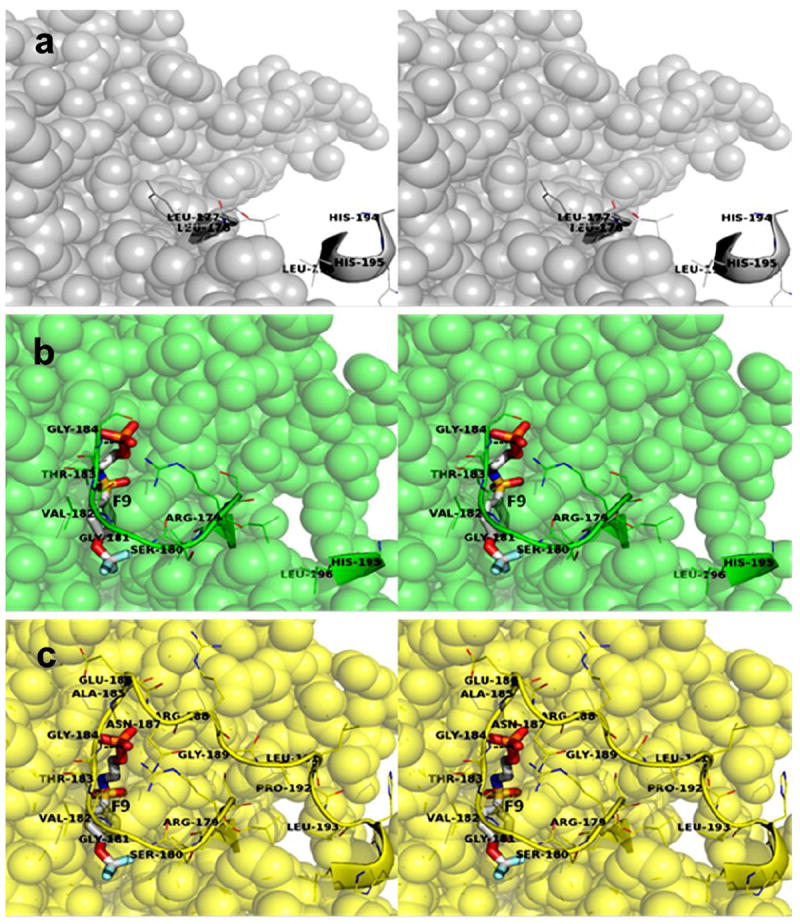
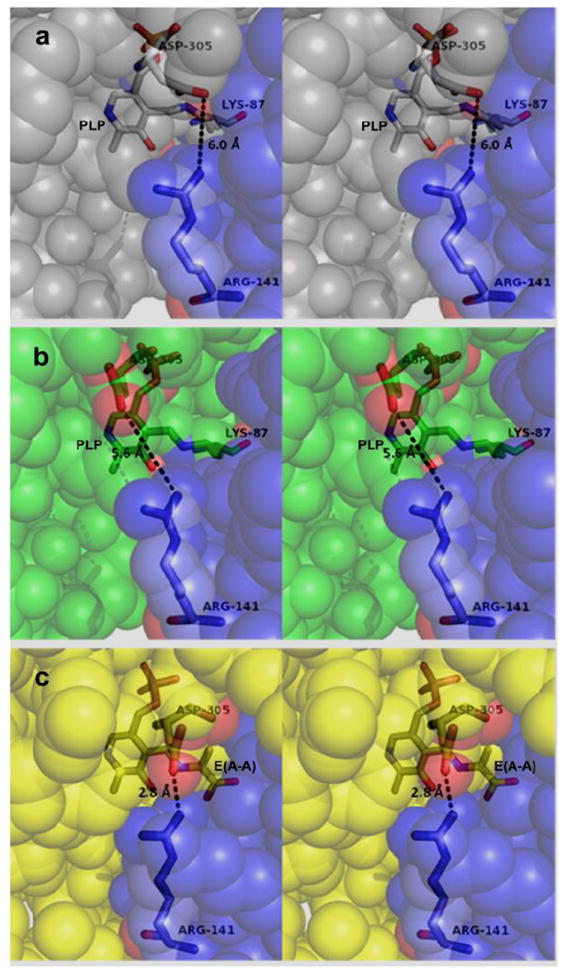
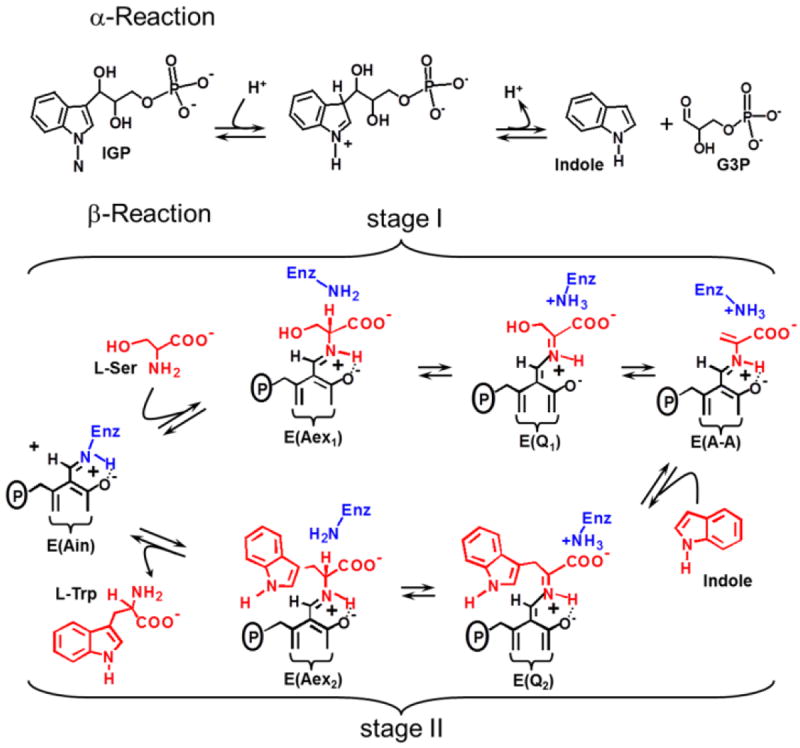
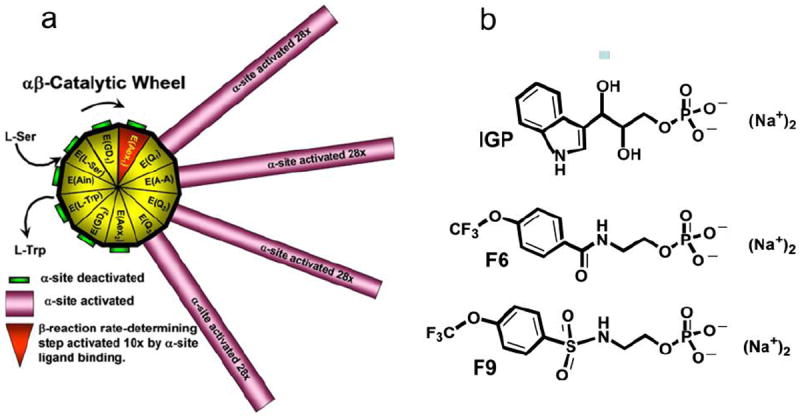
The allosteric regulation of substrate channeling in tryptophan synthase involves ligand-mediated allosteric signaling that switches the α- and β-subunits between open (low activity) and closed (high activity) conformations. This switching prevents the escape of the common intermediate, indole, and synchronizes the α- and β-catalytic cycles. (19)F NMR studies of bound α-site substrate analogues, N-(4'-trifluoromethoxybenzoyl)-2-aminoethyl phosphate (F6) and N-(4'-trifluoromethoxybenzenesulfonyl)-2-aminoethyl phosphate (F9), were found to be sensitive NMR probes of β-subunit conformation. Both the internal and external aldimine F6 complexes gave a single bound peak at the same chemical shift, while α-aminoacrylate and quinonoid F6 complexes all gave a different bound peak shifted by +1.07 ppm. The F9 complexes exhibited similar behavior, but with a corresponding shift of -0.12 ppm. X-ray crystal structures show the F6 and F9 CF3 groups located at the α-β subunit interface and report changes in both the ligand conformation and the surrounding protein microenvironment. Ab initio computational modeling suggests that the change in (19)F chemical shift results primarily from changes in the α-site ligand conformation. Structures of α-aminoacrylate F6 and F9 complexes and quinonoid F6 and F9 complexes show the α- and β-subunits have closed conformations wherein access of ligands into the α- and β-sites from solution is blocked. Internal and external aldimine structures show the α- and β-subunits with closed and open global conformations, respectively. These results establish that β-subunits exist in two global conformational states, designated open, where the β-sites are freely accessible to substrates, and closed, where the β-site portal into solution is blocked. Switching between these conformations is critically important for the αβ-catalytic cycle.


Conflict of interest statement

COMPETING INTERESTS

The authors have no competing interests.

Figures

Figure 1
Figure 1
a: 19F NMR spectra of the (F6)(Na+)E(Ain) and (F6)(Na+)E(A-A) complexes (black and red lines, respectively). Conditions: αβ, 605 μM; F6, 1.4 mM; Na+, 100 mM and L-Ser, 200 mM when present. b: UV/Vis absoption spectra of the NMR of samples in a. Enzyme concentration: αβ, 5.6 μM. c: 19F spectra of the bound peak for the conditions [F6] < [sites] to [F6] > [sites]. Conditions: αβ = 300 μM; F9 concentrations: 70 μM (black), 140 μM (purple), 350 μM (blue), 560 μM (green), 770 μM (yellow) 1.05 mM (light orange), 1.40 mM (dark orange). d: Dependencies of the F9 peak areas from Figure 1c for the bound species (black circles) and for the free species (orange triangles) (peaks not shown) on the concentration of F6. The intersection point of the tangents drawn through the data points indicates the F6 binding stoichiometry is approximately 1:1.
Figure 2
Figure 2
a: 1D 19F NMR spectra of the (F6)(Na+)E(A-A)(BZI) complex (black), the (F6)(Na+)E(Q)indoline complex (red) and the (F6)(Na+) E(Q)aniline complex (green). Conditions: αβ, 605 μM; Na+, 100 mM; L-Ser, 200 mM; and when present, BZI, 10 mM; indoline, 5 mM; aniline, 10 mM. b: UV/Vis absorption spectra of the (F6)(Na+)E(A-A)(BZI) complex (black; αβ, 7.5 μM) and of the (F6)(Na+)E(Q)indoline (red; αβ, 1.36 μM) from the NMR samples in Figure 2a.
Figure 3
Figure 3
a: 19F NMR peaks for the complexes of F9 with (Na+)E(Ain) (dashed black line), (Na+)E(A-A) (black), (Na+)E(A-A)(BZI) (yellow), (Na+)E(Q)indoline (green) and (Na+)E(Q)2AP (red). Concentrations: αβ, 0.605 mM; and when present, L-Ser, 20 mM; BZI, 10 mM; indoline, 4 mM; aniline, 10 mM; NaCl, 100 mM. b: Titration of (Na+)E(Ain) (αβ = 0.850 mM) with F9. F9 concentrations (increasing from bottom to top): 0.11 mM; 0.21 mM; 0.50 mM; 1.00 mM; 2.00 mM; 4.00 mM. The bound peak is located at -56.78 ppm. Figure 5c: Titration plot showing the area of the bound peak vs the concentration of F9. The intersection point of the tangents drawn through the data points indicates the F9 binding stoichiometry is approximately 1:1.
Figure 4
Figure 4
a. Model of the active site in the α-subunit of tryptophan synthase, showing (thin wireframe) the side chains fixed at their crystallographically-determined coordinates and (thick wireframe) the F6-substrate. The structure shown corresponds to the (F6)(Na+)E(Q)2AP form; an analogous model was built for (F6)(Na+)E(Ain). b: Superposition of the geometry-optimized F6 substrates for (F6)(Na+)E(Ain) (light gray carbon atoms) and (F6)(Na+)E(Q)2AP (dark gray carbon atoms) forms, also showing residue fragments within 3 Å of the CF3 group. These substructures were used for calculating NMR chemical shifts. The standard CPK scheme is used to designate the atom colors (H, white; C, gray; N, blue; F: green; O, red; P, orange; S, yellow).
Figure 5
Figure 5
Stereo views comparing the global conformations of the (F9)(Cs+)E(A-A), (F9)(Cs+)E(A-A)(BZI), and (F9)(Cs+)E(Q)2AP complexes (PDB accession codes 4HN4; 4HPX; and 4HPJ respectively). Each pair of panels (left and right) shows the cartoon ribbon structure of (F9)(Cs+)E(A-A) overlaid on the structure of another complex. Each panel on the left is a view into the α-site showing a stick rendering of F9, an indication of the tunnel at the α-β subunit interface, and a small portion of the β-subunits (green and yellow cartoon ribbons). Each panel on the left is a view into the β-site showing the PLP moieties as sticks. Color schemes: (F9)(Cs+)E(A-A) α-subunit magenta, β-subunit yellow; (F9)(Cs+)E(A-A)(BZI) and (F9)(Cs+)E(Q)2AP α-subunit orange, β-subunit green. Ligand color scheme: The ligand C atoms of the (F9)(Cs+)E(A-A) structure are colored yellow, other atoms are CPK colors. The ligand C atoms of the other structures are colored green, other ligand atoms are CPK colors. Notice that these sequence alignments show that, within experimental error, there is virtually no deviation of the positions of the Cα atoms.
Figure 6
Figure 6
Stereo views comparing of the α-sites of the (Na+)E(Ain), (F9)(Na+)E(Ain), and (F9)(Cs+)E(A-A) complexes. a: (Na+)E(Ain) (PDB accession code KFK): Residues α178-α194 (αL6) are completely disordered in this structure and the α-site is completely open. Color scheme: α-subunit residues are gray spheres, residues α176, α177 and α194-α196 are shown as cartoon ribbons. b: (F9)(Na+)E(Ain) (PDB accession code 2CLI): Residues α185-α194 are completely disordered in this structure and the α-site is open to solution at the ligand phosphoryl. Color scheme: α-subunit residues are gray spheres, residues are green spheres, residues α179-α184 and α195, and α196 are shown as cartoon ribbons. F9 is shown as a stick structure with CPK colors (F pale blue, C gray, N blue, O red, S yellow, P orange). c: (F9)(Cs+)E(A-A) (PDB accession code 4HN4): No residues in αL6 are disordered and the α-site is completely closed. Color scheme: α-subunit residues are yellow spheres, residues α179-α193 are shown as a cartoon ribbon. F9 is shown as a stick structure with CPK colors.
Figure 7
Figure 7
Stereo views comparing the β-sites of the (Na+)E(Ain), (F6)(Na+)E(Ain), and (F9)(Cs+)E(A-A) complexes. a: (Na+)E(Ain) (PDB accession code KFK): Residues β141 and β305 are too far apart in this structure to form a salt bridge, and the access of substrates/analogues from solution into the β-site is not hindered by steric or electronic interactions. Color scheme: β-subunit residues are light blue spheres (COMM domain) and gray spheres. The PLP Schiff base with βLys87, βArg141 and βAsp305 are shown as sticks. b: (F6)(Na+)E(Ain): Residues βArg141 and βAsp305 are too far apart to form a salt bridge (PDB accession code 2CLI) and the opening from solution into the β-site is not hindered by steric or electronic interactions. Color scheme: β-subunit residues are light blue spheres (COMM domain) and green spheres. 7c: (F9)(Cs+)E(A-A) (PDB accession code 4HN4): Residues βArg141 and βAsp305 form a hydrogen-bonded salt bridge which provides a steric and electrostatic barrier preventing the access of small molecules from solution.
Scheme 1
Scheme 1
Chemistry of the physiological reactions catalyzed by the α- and β-sites. Redrawn from reference .
Chart 1
Chart 1
a Representation of the chemical and conformational events which synchronize the α-and β- catalytic activities of αβ-dimeric units of tryptophan synthase and prevent the escape of indole. The 11 chemical states of the β-reaction are depicted as triangles around the hub of the catalytic wheel. The spokes connected to the triangles of the hub represent the activity states of the α-site as the β-site cycles through the 11 chemical states. The α-subunit is switched between inactive (green) and active (magenta) conformations in response to the interconversion among covalent intermediates along the β-site catalytic path. This switching activates or deactivates the α-site by ~28-fold. Activation of the α-site occurs when the L-Ser external aldimine, E(Aex1) is converted to the α-aminoacrylate Schiff base, E(A-A), while deactivation occurs when the quinonoid intermediate, E(Q3), is converted to the L-Trp external aldimine, E(Aex2). During Stage I of the β-reaction the rate-limiting conversion of E(Aex1) (red triangle) to E(A-A) is activated at least 10-fold by IGP binding to the α-site. (Figure taken from Dunn et al.). This switching between low (open) and high (closed) activity states synchronizes the α- and β-catalytic activities, preventing the escape of indole as it is transferred between the α- and β-sites. b: Structures of N-(4’-trifluoromethoxybenzoyl)-2-aminoethyl phosphate (F6), and N-(4’-trifluoromethoxybenzenesulfonyl)-2-aminoethyl phosphate (F9).

References

    1. Monod J, Wyman J, Changeux JP. On the nature of allosteric transitions: a plausible model. J Mol Biol. 1965;12:88–118. - PubMed
    1. Grant G. Allosteric regulation. Arch Biochem Biophys. 2012;519:67–231. Guest editor. - PubMed
    1. Kantrowitz ER. Allostery and cooperativity in Escherichia coli aspartate transcarboxylase. Arch Biochem Biophys. 2012;519:81–90. - PMC - PubMed
    1. Guerra AJ, Giedroc DP. Metal site occupancy and allosteric switching in bacterial metal sensor proteins. Arch Biochem Biophys. 2012;519:210–222. - PMC - PubMed
    1. Batiza AF, Rayment I, Kung C. Channel gate! Tension, leak and disclosure. Structure. 1999;7:99–103. - PubMed

Publication types

MeSH terms