. 2013 Aug 30;288(35):25387-25399.
doi: 10.1074/jbc.M113.479717. Epub 2013 Jul 3.

Key mutations alter the cytochrome P450 BM3 conformational landscape and remove inherent substrate bias

Affiliations

Key mutations alter the cytochrome P450 BM3 conformational landscape and remove inherent substrate bias

Christopher F Butler et al. J Biol Chem. .

Abstract

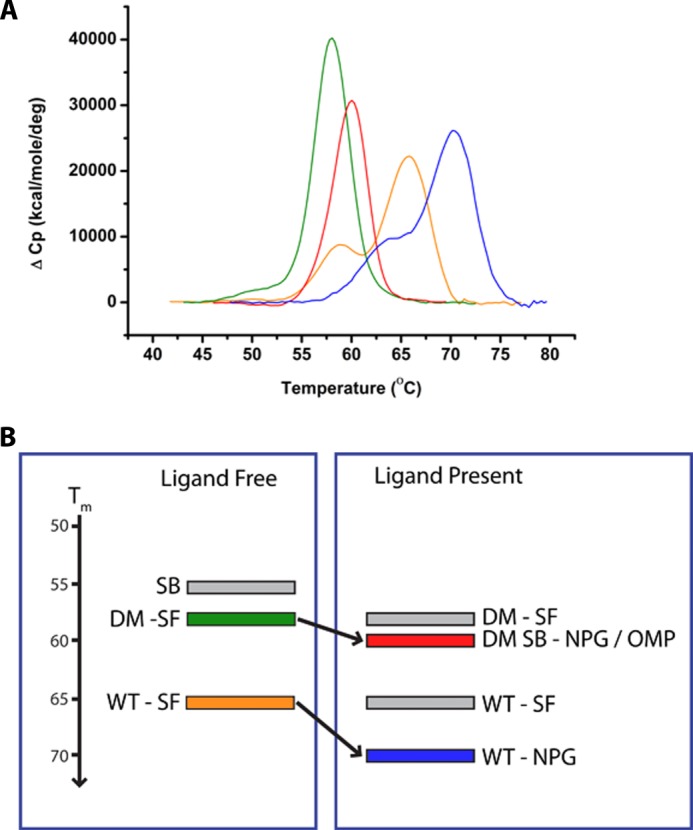
Cytochrome P450 monooxygenases (P450s) have enormous potential in the production of oxychemicals, due to their unparalleled regio- and stereoselectivity. The Bacillus megaterium P450 BM3 enzyme is a key model system, with several mutants (many distant from the active site) reported to alter substrate selectivity. It has the highest reported monooxygenase activity of the P450 enzymes, and this catalytic efficiency has inspired protein engineering to enable its exploitation for biotechnologically relevant oxidations with structurally diverse substrates. However, a structural rationale is lacking to explain how these mutations have such effects in the absence of direct change to the active site architecture. Here, we provide the first crystal structures of BM3 mutants in complex with a human drug substrate, the proton pump inhibitor omeprazole. Supported by solution data, these structures reveal how mutation alters the conformational landscape and decreases the free energy barrier for transition to the substrate-bound state. Our data point to the importance of such "gatekeeper" mutations in enabling major changes in substrate recognition. We further demonstrate that these mutants catalyze the same 5-hydroxylation reaction as performed by human CYP2C19, the major human omeprazole-metabolizing P450 enzyme.

Keywords: Calorimetry; Conformational Destabilization; Crystal Structure; Cytochrome P450; Drug Metabolism; Enzyme Catalysis; Hydroxylase; Omeprazole; P450 BM3; Site-directed Mutagenesis.


Figures

FIGURE 1.
FIGURE 1.
Structure of omeprazole. The chemical structure of the proton pump inhibitor OMP is shown. The pyridine ring shows the accepted numbering (hydroxylation occurs at the 5-methyl position). Also shown is the characteristic MS fragmentation position that gives the methoxybenzimidazole and 4-methoxy-3,5-dimethylpyridin-2-yl (pyridinyl) fragments. Hydroxylation on the 5-methyl group is performed by engineered variants of P450 BM3 described in this study. 5-Hydroxylation is also the primary reaction catalyzed by the major human OMP-metabolizing enzyme CYP2C19. Omeprazole is chiral around the central sulfur atom. As a drug preparation, omeprazole is a racemate of two isomers.
FIGURE 2.
FIGURE 2.
Binding and oxidation of omeprazole by P450 BM3 mutants. A, binding titration for F87V/A82F (DM) intact P450 BM3 (1 μm) with omeprazole. Main panel, plot of the induced heme Soret absorption change (ΔA389–ΔA419) versus [OMP] with data fitted to yield a Kd = 0.212 ± 0.014 μm. Inset, selected OMP-induced absorption difference spectra from titration at OMP concentrations: 0.05 μm (green), 0.15 μm (blue), 0.30 μm (magenta), 0.40 μm (purple), and 1.0 μm (red). B, turnover data for OMP with WT (black column), A82F (red), F87V (blue), and F87V/A82F (DM, orange) P450 BM3 enzymes. Assays were done for 30 min. Products (5-OH OMP and 5-COOH OMP) are shown as a percentage of the initial OMP concentration used in the assay, with data corrected for an internal standard (fluconazole) and for enzyme-independent degradation of OMP substrate.
FIGURE 3.
FIGURE 3.
LC-MS analysis of products derived from omeprazole oxidation by the P450 BM3 F87V/A82F (DM) double mutant enzyme. The figures show data from LC-MS studies of OMP before and after its enzymatic turnover by the P450 BM3 DM (F87V/A82F) enzyme. These data demonstrate hydroxylation and subsequent oxidation of OMP, and also the fragmentation of the OMP (and its oxidized products) that occurs during MS analysis. A (retention time = 5.39 min) shows data for OMP prior to addition of enzyme and initiation of its oxidation by the BM3 DM enzyme. Peaks at m/z 346.1212 and 198.0581 (circled) correspond to the fragmentation of OMP at the sulfone group (between the sulfur and the methoxybenzimidazole moiety), with the smaller species representing the sulfur-containing fragment. B (retention time = 5.26 min) is following an enzymatic reaction for 30 min. The m/z peaks at 362.1162 and 214.0530 (circled) are for the 5-OH OMP and its hydroxylated fragment. C, (retention time = 5.32 min) is following an enzymatic reaction for 30 min. The m/z peaks at 376.0955 and 228.0323 (circled) are for the 5-COOH OMP and its carboxylated fragment.
FIGURE 4.
FIGURE 4.
Optical binding titration for the BM3 DM heme domain with 5-OH OMP. A shows UV-visible binding spectra for a titration of intact DM BM3 (∼1.0 μm, red spectrum) and following addition of 2 μm (blue), 6 μm (magenta), 16 μm (orange), and 40 μm (black) 5-OH OMP. The Soret band shifts from 418 to 393 nm on binding 5-OH OMP. The inset shows difference spectra obtained by subtraction of the substrate-free spectrum from each of the shown 5-OH-bound spectra (color coding remains same). B shows a plot of induced Soret absorbance change (ΔA389 nm − ΔA421 nm) versus the relevant [5-OH OMP], with data fitted using the Morrison equation to give a Kd value of 2.62 ± 0.19 μm (26). 5-OH OMP binds both A82F and DM heme domains to induce a substrate-like shift in heme iron spin state equilibrium toward the high spin state. Full Kd and Vmax data for 5-OH OMP binding/turnover with WT and mutant BM3 enzymes are given in Table 2.
FIGURE 5.
FIGURE 5.
Time course of substrate oxidation and product formation in the reaction of the P450 BM3 DM enzyme with omeprazole. OMP substrate is shown in black squares, and the products 5-OH OMP and 5-COOH OMP are shown in open circles and open triangles, respectively. Reactions were done as described under “Experimental Procedures.” The reactions reach completion in ∼10–15 min, with most substrate oxidation (and 5-OH OMP formation) occurring in the first 2.5 min.
FIGURE 6.
FIGURE 6.
Structures of P450 BM3 enzymes and their omeprazole-binding sites. A, comparison of WT and mutant BM3 heme domain structures. The FG-helices are in color, and the remainder of the protein structures is depicted in grayscale. The A82F mutation is shown in spheres (where present) and substrate molecules are shown in atom-colored spheres. The heme is shown as red sticks. Panel 1, F87V/A82F (DM) P450 BM3 mutant heme domain in complex with OMP. Panel 2, DM heme domain in the ligand-free form. Panel 3, WT heme domain complex with NPG (PDB code 1JPZ) (34). Panel 4, WT heme domain in the ligand-free form (PDB code 1BU7) (57). B, mode of binding of OMP is shown for the DM (left panel) and A82F (right panel) mutant BM3 heme domain active sites. Because of weak electron density, the labile sulfone oxygen is omitted from the models shown. Key residues contacting the ligand are shown as sticks, and water molecules hydrogen bonding to the OMP are in red. Right panel, OMP from the A82F heme domain structure is overlaid with that from the DM heme domain. Right panel, Phe-82 residues are shown in green for the DM and in cyan for the A82F mutant. The DM Val-87 is in green, and the A82F Phe-87 is in cyan. The distance between the P450 heme iron and the OMP 5-methyl group is 3.9 Å in the A82F heme domain and 4.1 Å in the DM heme domain.
FIGURE 7.
FIGURE 7.
Interactions of omeprazole in the active site of the A82F BM3 heme domain. The diagram shows the binding site of OMP (without the labile sulfinyl oxygen) in the A82F mutant BM3 heme domain. For OMP, carbon atoms are shown in black, oxygens in red, sulfur in yellow, nitrogens in blue, and the oxygens of water molecules in cyan. Bonds in the OMP substrate are shown in purple, and bonds in selected amino acids are in brown. Hydrogen bonds are shown (with their lengths) as green dashed lines. Amino acids making hydrophobic interactions with the OMP are shown as red arcs with radiating lines. OMP atoms involved in these hydrophobic interactions are shown with radiating red lines. A direct hydrogen bond interaction is made between the backbone carbonyl of Leu-437 and one of the OMP benzimidazole group nitrogens (NE1). A further bridging hydrogen bond occurs from the Ser-72 hydroxyl group through a water molecule (water 781) to the other benzimidazole nitrogen (NV). A final bridging hydrogen bond interaction occurs between the backbone nitrogen of Ala-74 and the benzimidazole methoxy oxygen (O3) via another water molecule (water 761). A number of hydrophobic protein-OMP interactions are seen. These include interactions with Leu-188 at the benzimidazole methoxy group (C4) and with Ala-328 at the pyridinyl 5-methyl group (C1). The diagram was produced using Ligplot+ using the structure of the A82F heme domain-omeprazole complex solved in this study (PDB code 4KEW) (58).
FIGURE 8.
FIGURE 8.
Stereoviews of structural overlays of substrate-bound forms of the BM3 A82F-containing mutant heme domains with WT BM3. A shows a stereoview of the A82F-OMP heme domain active site (in red) with that of the WT-NPG structure (PDB 1JPZ in blue) (34). Key amino acids are shown in lines, and the bound ligands are shown in atom-colored sticks (OMP with magenta carbons; NPG with light blue carbons). Besides the nature of the ligand itself, and the obvious difference of the A82F mutation, there are very few differences between the structures, and these are mainly limited to Phe-87 occupying multiple conformations in the A82F-OMP structure. B shows an alternative view of the BM3 double mutant (DM, F87V/A82F) OMP-bound heme domain structure overlaid with the NPG substrate-bound structure of the WT BM3 heme domain. The F/G-helix region is colored in red for the BM3 DM and in blue for the substrate-bound WT BM3. Key amino acid residues and the respective ligands are shown as sticks. As also seen for A, surprisingly little change can be observed in the DM protein structure compared with WT BM3, despite the distinct nature of the ligand and the introduction of two mutations.
FIGURE 9.
FIGURE 9.
Structural overlay of the omeprazole-bound A82F mutant with the WT BM3 heme domain. A stereoview is shown for a structural overlay of the A82F BM3 heme domain with the WT heme domain (PDB 1BU7). Color coding is as in Fig. 6, with F/G-helices in green for the substrate-free A82F mutant and in yellow for the substrate-free WT BM3 heme domain.
FIGURE 10.
FIGURE 10.
Conformational equilibria and the relationship with structural stability in P450 BM3. A, DSC data for the WT and DM P450 BM3 heme domains in substrate-free, OMP-, and NPG-bound forms. B, schematic overview of the conformational equilibria proposed for the BM3 WT and DM mutant heme domains. Individual conformational states (as represented by crystal structures) are depicted as gray-shaded rectangles when largely unpopulated and color rectangles (color-coded to match A) when significantly populated. The y axis indicates the relative Tm values for the unfolding of these proteins.

References

    1. Guengerich F. P. (2005) in Cytochrome P450: Structure, Mechanism and Biochemistry (Ortiz de Montellano P. R., ed) 3rd Ed., pp. 377–530, Kluwer Academic/Plenum Press, New York
    1. Munro A. W., Girvan H. M., McLean K. J. (2007) Variations on a (t)heme–novel mechanisms, redox partners, and catalytic functions in the cytochrome P450 superfamily. Nat. Prod. Rep. 24, 585–609 - PubMed
    1. Xu F., Bell S. G., Rao Z., Wong L. L. (2007) Structure-activity correlations in pentachlorobenzene oxidation by engineered cytochrome P450cam. Protein Eng. Des. Sel. 20, 473–480 - PubMed
    1. Peters M. W., Meinhold P., Glieder A., Arnold F. H. (2003) Regio- and enantioselective alkane hydroxylation with engineered cytochromes P450 BM-3. J. Am. Chem. Soc. 125, 13442–13450 - PubMed
    1. Munro A. W., Daff S., Coggins J. R., Lindsay J. G., Chapman S. K. (1996) Probing electron transfer in flavocytochrome P-450 BM3 and its component domains. Eur. J. Biochem. 239, 403–409 - PubMed

Publication types

MeSH terms