. 2015 Apr 13;11(4):e1004795.
doi: 10.1371/journal.ppat.1004795. eCollection 2015 Apr.

The aspartate-less receiver (ALR) domains: distribution, structure and function

Affiliations

The aspartate-less receiver (ALR) domains: distribution, structure and function

Andrew F Maule et al. PLoS Pathog. .

Erratum in

Abstract

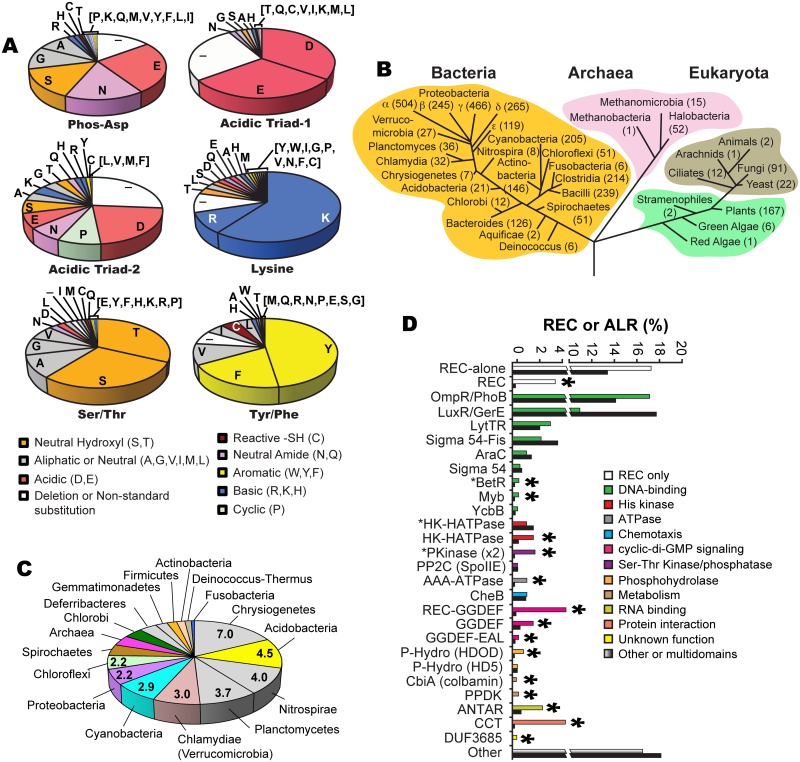
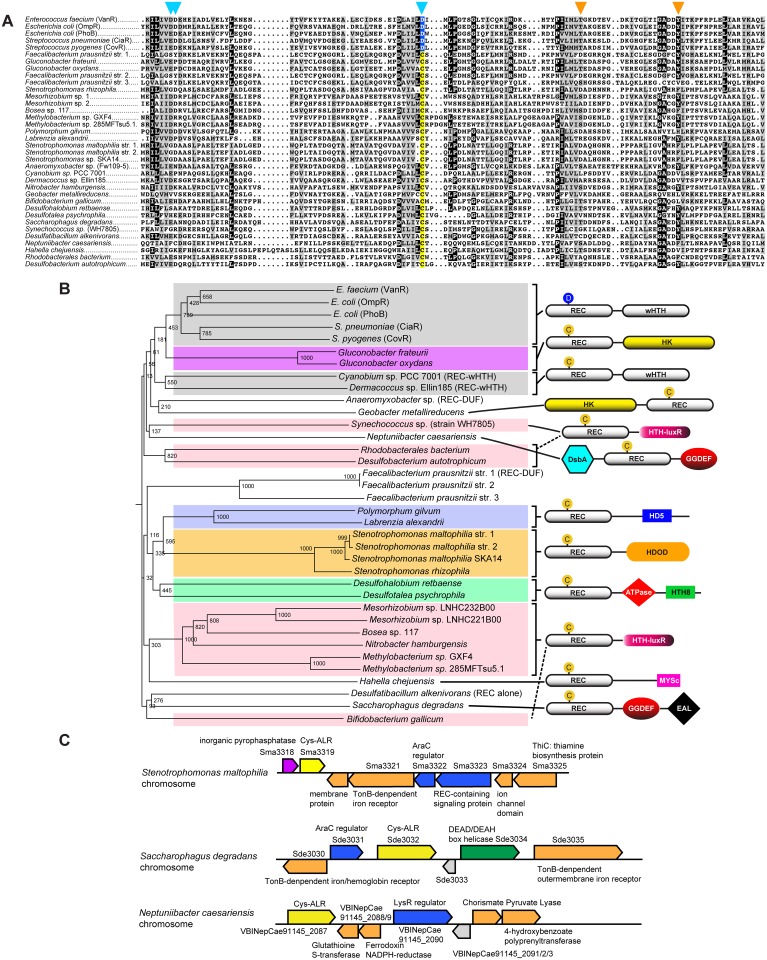
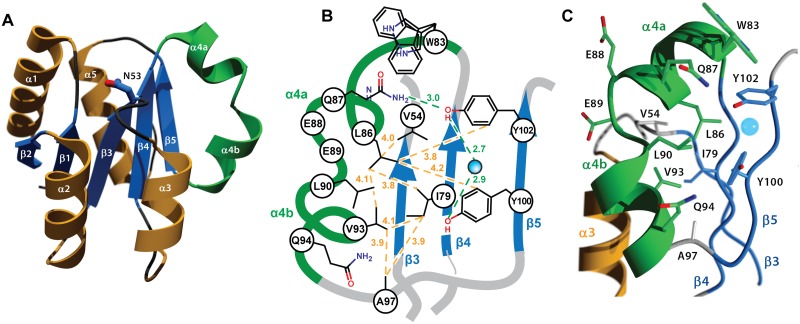
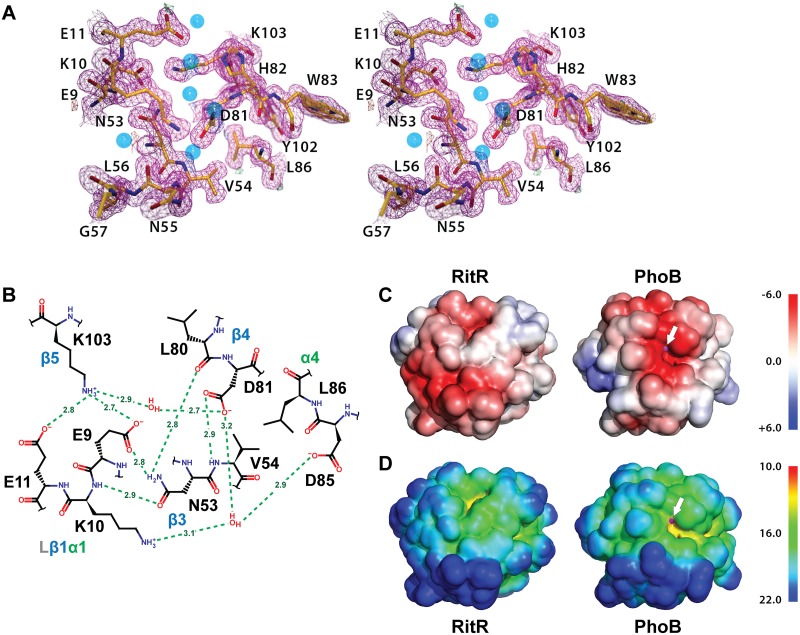
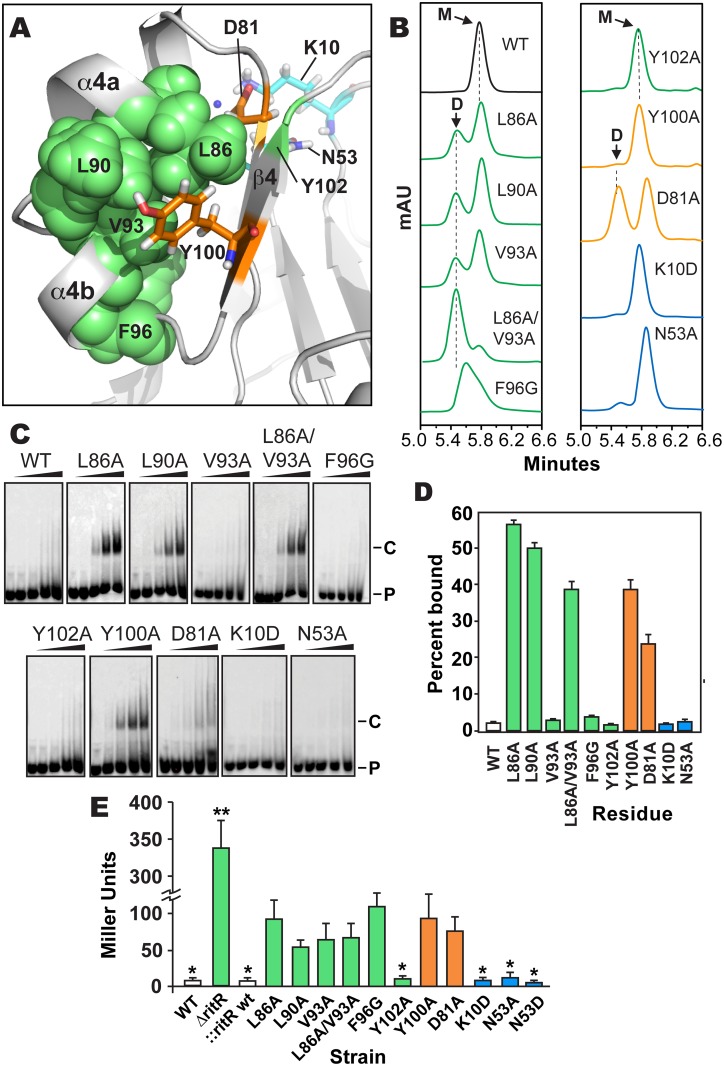
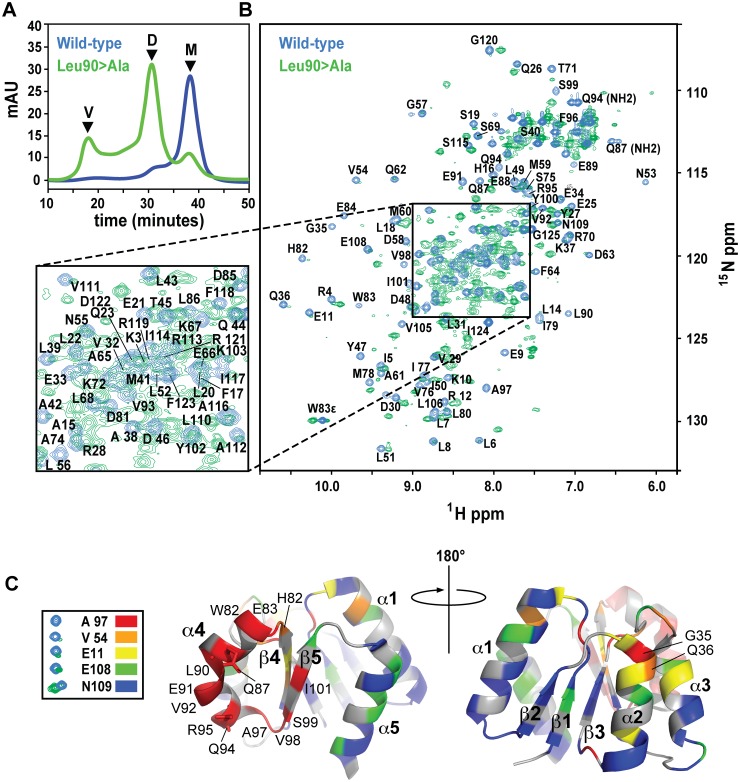
Two-component signaling systems are ubiquitous in bacteria, Archaea and plants and play important roles in sensing and responding to environmental stimuli. To propagate a signaling response the typical system employs a sensory histidine kinase that phosphorylates a Receiver (REC) domain on a conserved aspartate (Asp) residue. Although it is known that some REC domains are missing this Asp residue, it remains unclear as to how many of these divergent REC domains exist, what their functional roles are and how they are regulated in the absence of the conserved Asp. Here we have compiled all deposited REC domains missing their phosphorylatable Asp residue, renamed here as the Aspartate-Less Receiver (ALR) domains. Our data show that ALRs are surprisingly common and are enriched for when attached to more rare effector outputs. Analysis of our informatics and the available ALR atomic structures, combined with structural, biochemical and genetic data of the ALR archetype RitR from Streptococcus pneumoniae presented here suggest that ALRs have reorganized their active pockets to instead take on a constitutive regulatory role or accommodate input signals other than Asp phosphorylation, while largely retaining the canonical post-phosphorylation mechanisms and dimeric interface. This work defines ALRs as an atypical REC subclass and provides insights into shared mechanisms of activation between ALR and REC domains.


Conflict of interest statement

The authors have declared that no competing interests exist.

Figures

Fig 1
Fig 1. ALR statistics and phylogeny.
(a) Frequency of amino acid substitutions within six key ‘invariant’ REC residues in ALR sequences: the (now changed in ALRs) conserved histidine kinase phosphorylated aspartate residue position that defines the ALR subfamily (Phospho-Asp), acidic triad residue-1 (Glu9 in RitR) and acid triad residue-2 (Lys10 in RitR) that normally help coordinate the metal ion active pocket, the Tyrosine/Phenylalanine (Tyr/Phe, Tyr100 in RitR) and Threonine/Serine (Thr/Ser, Asp81 in RitR) that make up the Y/T-coupling system, and the conserved pocket Lys (Lys103 in RitR). Notice that where catalytic active pocket Asp/Lys residues have often been changed in ALR sequences (top panel), the T/Y-coupling residues generally remain conserved (bottom panel). This trend in conservation is also observed for the acidic triad-1 and the universally conserved pocket Lys residue (Lys103 in RitR), but not for acidic triad-2. (b) Taxonomic distribution of ALR sequences. The number of ALRs discovered in the given class or phylum is shown in parentheses. (c) Distribution of the average number of ALR sequences per completed genome by phyla. (d) Bar graph of the percentage contribution of a given Effector Domain (ED) within total REC sequences (shown as black bars) and ALR sequences only (shown as non-black bars). An asterisk above the bars indicates that ALRs are enriched for the ED by over 50% within the ALR population compared to their representation within typical REC sequence populations. An asterisk in front of the ED name indicates that the ALR or REC domain is (unusually) C-terminal to the ED sequence.
Fig 2
Fig 2. Cys-ALRs.
(a) Alignment of the 26 extracted ALR domains that contain a cysteine residue in place of the typical phosphorylated Asp seen in canonical REC domain sequences (colored yellow). For comparison, Asp-containing REC domains VanR, OmpR, PhoB, CiaR and CovR were included and their conserved phosphorylatable Asp residue (colored blue). The ALR sequences were imported in FASTA format into Clustal X 2.1 [82]. The alignment was then uploaded into MacBoxShade 2.15 (Institute of Animal Health, Pirbright, UK) for visual representation. (b) Phylogenetic tree of Cys-ALRs shown in (a). Related clades are grouped by color and a schematic representation of their domain architecture is shown on the right. Posterior probabilities are shown at the branch points. The circle with a “C” or “D” indicates a Cys or Asp amino acid, respectively, located at the phospho-Asp position. Domain architecture abbreviations are as follows: REC, receiver; HK, histidine kinase; HTH, helix-turn-helix; wHTH, winged helix-turn-helix; DsbA, bacterial disulfide oxidoreductase; GGDEF, cyclic-di-GMP; EAL, diguanylate phosphodiesterase; HDOD and HD5, phosphohydrolase; HTH-luxR, luxR family of bacterial transcription factors; MYSc, myocin domain; DUF, domain of unknown function. The alignment was generated using Clustal X 2.1 [82] and uploaded for phylogenetic display into Archaeopteryx [83].
Fig 3
Fig 3. Crystal structure of the RitR REC domain.
(a) Cartoon representation of RitRALR with helices α1- α3 and α5 colored orange, the unusual α4 helix colored green, and the β-strands colored blue. The equivalent of the phospho-modified Asp residue found in typical REC domains, RitR coordinate Asn53, is shown as ball-and-stick with blue carbon and red oxygen atoms. (b) Schematic view showing the pattern of RitR van der Waals interactions (yellow dotted lines) and hydrogen-bonding network (green dotted lines) in the dimer / Gate region of the structure. (c) Close-up of the kinked α4 helix (in green) and surrounding residues. The blue sphere is a water molecule.
Fig 4
Fig 4. Structure of the RitR ‘active’ pocket.
(a) Stereoview of the electron density in the RitR active site (magenta mesh) contoured at 1.5 σ. Water molecules are shown as blue spheres. Notice the lack of a metal ion in the typical metal-binding site near Glu9. (b) Schematic view of the RitR REC ‘active site’ showing predicted hydrogen-bonding interactions (green dotted lines) with distances in Angstroms (Å). (c) Comparison of the vacuum electrostatic surface potentials of RitRALR, left, and the PhoB REC domain, right. The Mg2+ site in PhoB is indicated by a magenta sphere, which can be seen protruding slightly through the surface (denoted by the white arrow). (d) Comparison of the surfaces of the RitR and PhoB REC domains colored by distance from the center of mass of each protein. Not only is the electronegative environment in the metal-binding site of PhoB lost in RitR, the cleft that normally holds the metal ion (yellow region near the white arrow) is missing as well. Figure generated using PyMol (Version 1.4.1, Schrödinger, LLC).
Fig 5
Fig 5. Analysis of RitR mutations.
(a) Cartoon representation of the RitRALR atomic structure depicting important Gate residues (shown in green), the conserved Tyr100 and Asp81 Y/T-coupling residues (shown in orange) and acidic triad residues (shown in cyan). (b) SEC of RitRFL variants (see S6 Fig for protein purity). mAU, milli Absorbance Units; WT, Wild-type RitRFL protein; D, Dimeric form of RitRFL; M, Monomeric form of RitRFL. (c) EMSA shifts of RitRFL variants in the presence of HEX-labeled BS2 33-mer double-stranded DNA oligomer at 0, 0.22, 0.66, 2.2 and 6.6 μM concentrations (left to right). P, Hex-BS2 DNA Probe; C, RitR-(HEX-BS2 DNA) shifted Complex. (d) EMSA quantification of RitRFL variants (2.2 μM) binding to HEX-BS2 DNA. Values represent mean +/- SEM, n = 3. (e) Effect of RitR mutations on Piu promoter activity as measured by β-galactosidase levels (in Miller units). One asterisk indicates a P value of <0.05, and two asterisks a P value of <0.01 as determined by Student’s t-test. Error bars represent mean +/- SEM. t-test comparisons were made using the Y100A mutant as a reference.
Fig 6
Fig 6. SEC and NMR analysis of wild-type RitRALR and the RitRALR Leu90>Ala mutant proteins.
(a) SEC of the proteins. V, void volume; D, dimer peak; M, monomer peak. mAU, milli Absorbance Units. (b) 1H-15N HSQC spectra of the wild-type RitRALR (blue peaks) and Leu90>Ala mutant (green peaks). Assigned amides and NH2 groups from Gln87 and Gln94 are also labeled. ppm, parts per million. (c) Heat map of chemical shift changes between the Leu90>Ala mutant and wild-type proteins. Examples of typical peaks used to calculate the degree of change between the mutant and wild-type for the heat map, and their associated coloring scheme are shown on the left. The RitR heat map structures show the proposed α4-β5 dimeric interface from two perspectives that differ by 180°. Secondary structures and residues that experienced large changes in their chemical environments when transitioning from the wild-type monomer to the mutant dimeric structure are labeled.

References

    1. Ulrich LE, Koonin EV, Zhulin IB (2005) One-component systems dominate signal transduction in prokaryotes. Trends Microbiol 13: 52–56. - PMC - PubMed
    1. Hoch JA, Silhavy TJ, editors (1995) Two-component signal transduction. Washington, D.C.: American Society for Microbiology.
    1. Bourret RB, Silversmith RE (2010) Two-component signal transduction. Curr Opin Microbiol 13: 113–115. 10.1016/j.mib.2010.02.003 - DOI - PMC - PubMed
    1. Gao R, Stock AM (2009) Biological insights from structures of two-component proteins. Annu Rev Microbiol 63: 133–154. 10.1146/annurev.micro.091208.073214 - DOI - PMC - PubMed
    1. Volkman BF, Lipson D, Wemmer DE, Kern D (2001) Two-state allosteric behavior in a single-domain signaling protein. Science 291: 2429–2433. - PubMed

Publication types

MeSH terms

Substances

Associated data

LinkOut - more resources