. 2014 Feb 13;156(4):717-29.
doi: 10.1016/j.cell.2014.01.011. Epub 2014 Feb 6.

X-ray structure of acid-sensing ion channel 1-snake toxin complex reveals open state of a Na(+)-selective channel

Affiliations

X-ray structure of acid-sensing ion channel 1-snake toxin complex reveals open state of a Na(+)-selective channel

Isabelle Baconguis et al. Cell. .

Abstract

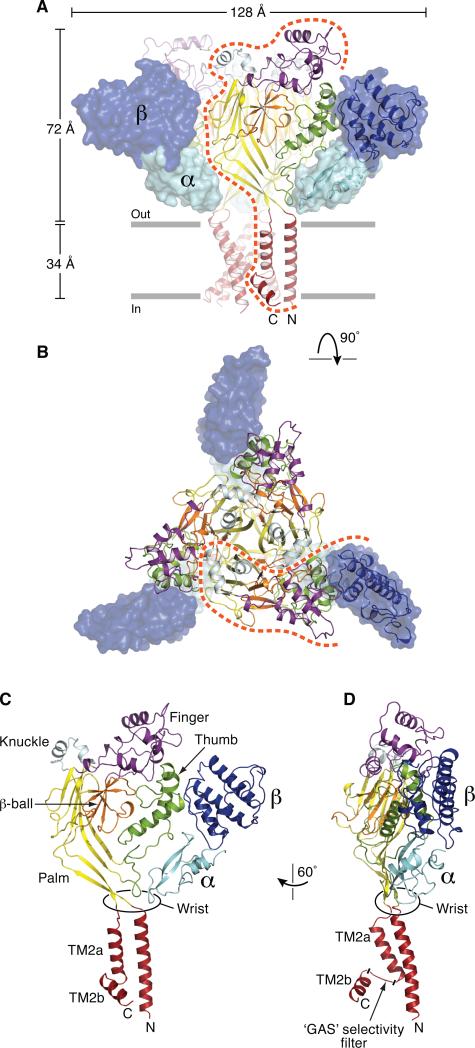
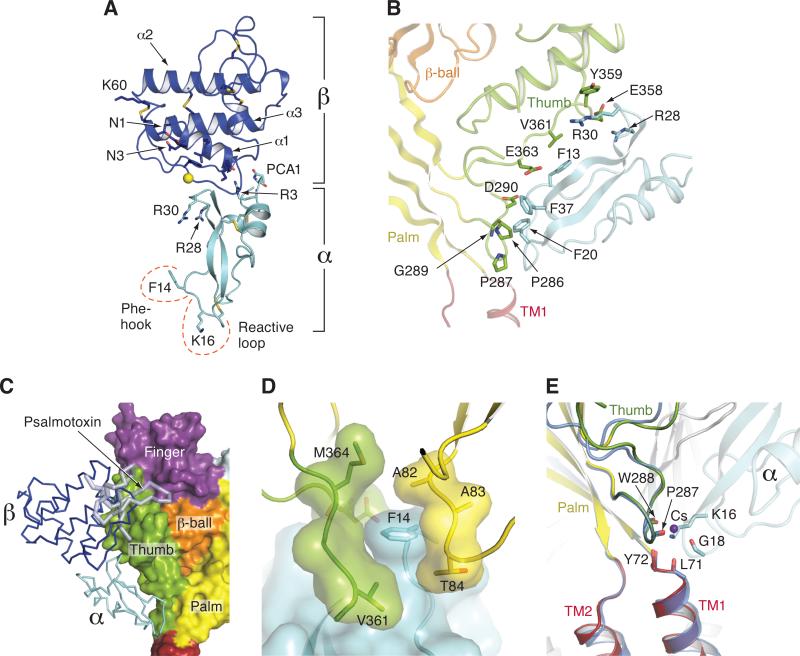
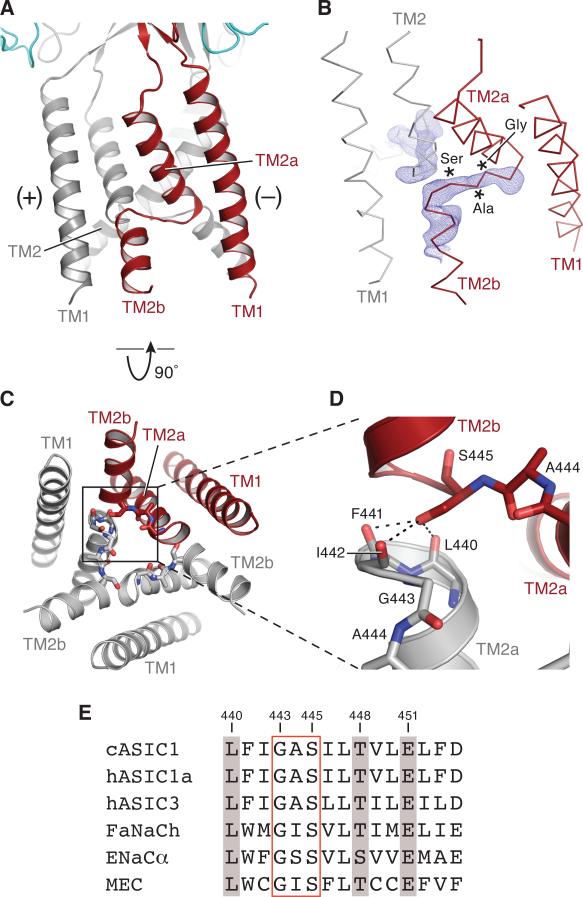
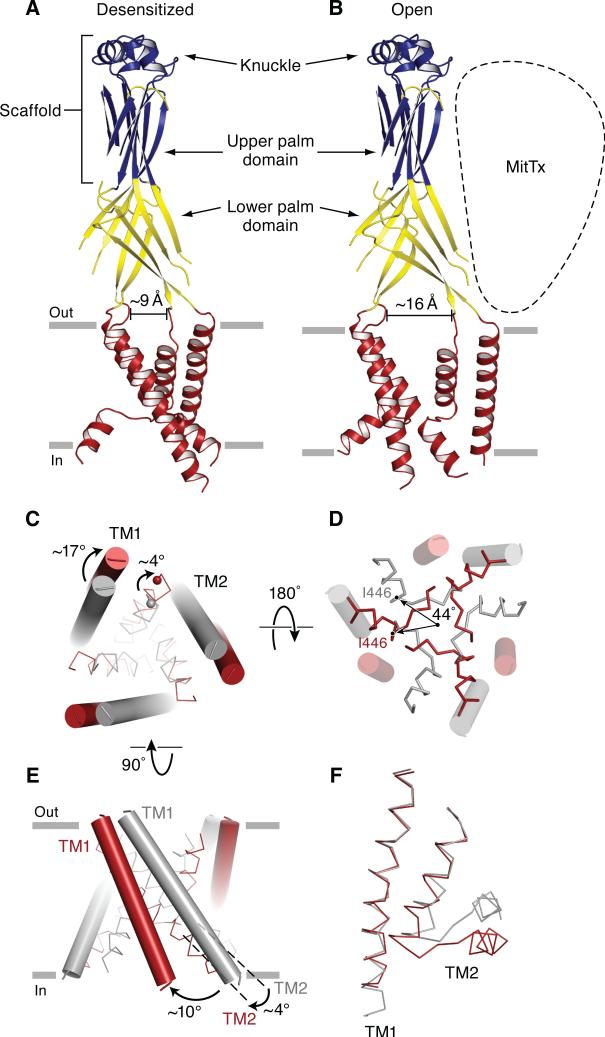
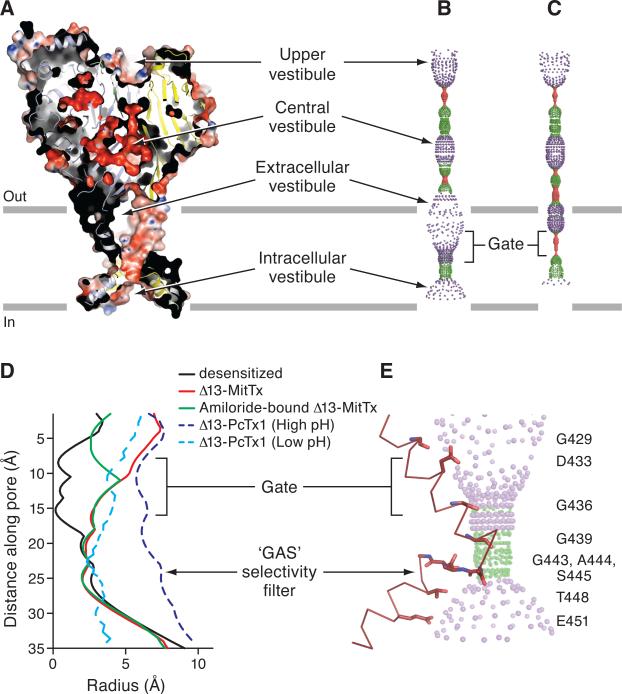
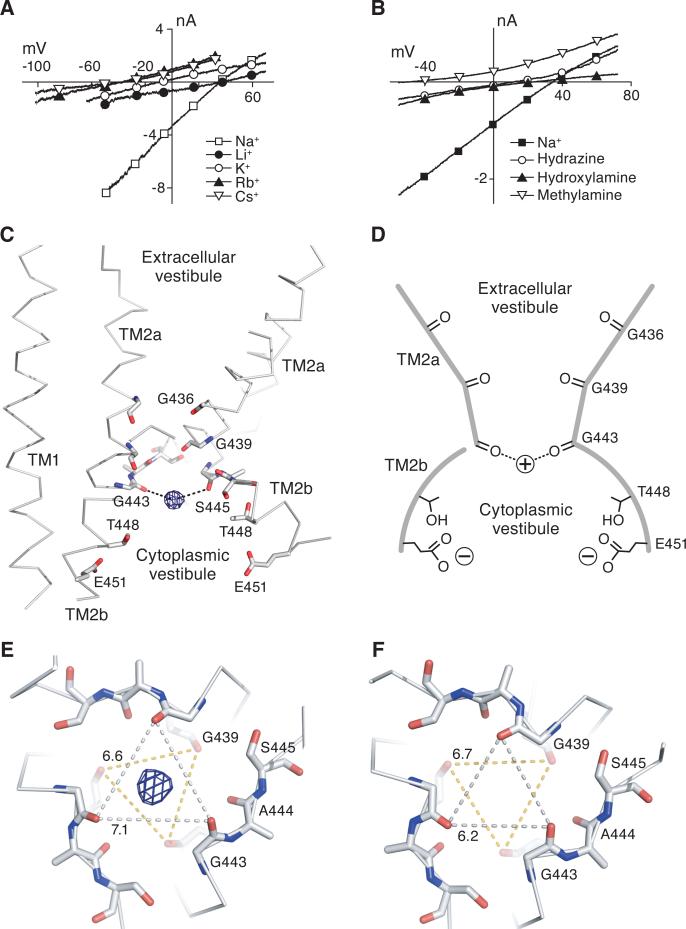
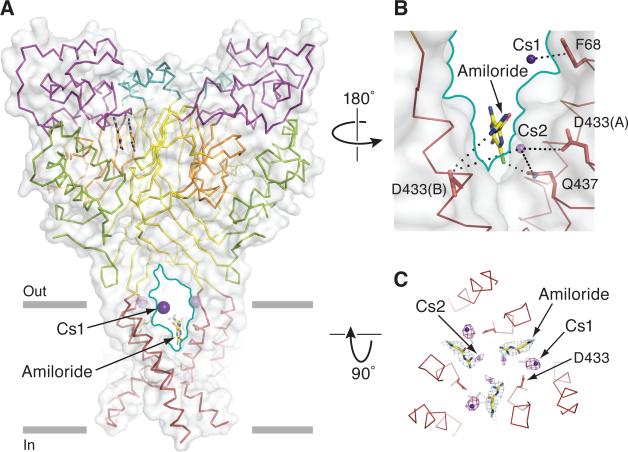
Acid-sensing ion channels (ASICs) detect extracellular protons produced during inflammation or ischemic injury and belong to the superfamily of degenerin/epithelial sodium channels. Here, we determine the cocrystal structure of chicken ASIC1a with MitTx, a pain-inducing toxin from the Texas coral snake, to define the structure of the open state of ASIC1a. In the MitTx-bound open state and in the previously determined low-pH desensitized state, TM2 is a discontinuous α helix in which the Gly-Ala-Ser selectivity filter adopts an extended, belt-like conformation, swapping the cytoplasmic one-third of TM2 with an adjacent subunit. Gly 443 residues of the selectivity filter provide a ring of three carbonyl oxygen atoms with a radius of ∼3.6 Å, presenting an energetic barrier for hydrated ions. The ASIC1a-MitTx complex illuminates the mechanism of MitTx action, defines the structure of the selectivity filter of voltage-independent, sodium-selective ion channels, and captures the open state of an ASIC.


Figures

Figure 1
Figure 1
Architecture of the Δ13-MitTx complex. (A) Subunits of Δ13 and MitTx are color-coded by domain. The Δ13 ion channel is in cartoon and MitTx subunits are in surface representation with one heterodimer also shown in cartoon representation. The orange dashed line defines the region of one subunit. (B) View along the 3-fold axis of symmetry, from the extracellular side of the membrane. (C, D) Cartoon representation of a single subunit derived from the Δ13-MitTx complex. See also Figure S1 and Table S1.
Figure 2
Figure 2
Structures of MitTx and illustration of key residues and interactions. (A) Structure of MitTx derived from the complex with Δ13. In the heterodimeric α/β toxin complex, each subunit buries ~500 Å of solvent accessible surface area at the subunit interface. Residues near the N and C- termini of the α subunit play particularly important roles in the heterodimeric complex, forming helix-capping contacts to the C-terminus of the α1 helix of the β subunit, as well as mediating interactions with the β-wing domain. The α subunit, depicting the key Phe 14 and Lys 16 residues, along with the 3 disulfide bonds. (B) Illustration of residues that participate in extensive interactions between the α subunit of MitTx (cyan) and residues on the thumb domain (green) with portions of the Δ13 palm domain (light yellow) and β-ball (light orange) also shown. Phe 13, 20 and 37 supplement the interactions between α and the thumb of Δ13, and together with Arg 28 and 30, make interactions with residues on the α4 and α5 helices. (C) The binding site of MitTx (blue and cyan) overlaps with the psalmotoxin (light blue) binding site. Δ13 is shown in surface representation and toxins are in ribbon representation. (D) View of the subunit interface separated by Phe 14 of the α subunit, which serves as a ‘flange’ of the MitTx ‘churchkey.’ (E) View of the ‘wrist’ region following superposition of Cα positions of residues 285-290 and 70-74 of Δ13-MitTx and low pH Δ13-PcTx1 soaked in Cs+. Coordination of the ammonium group of Lys 16 is similar to the carbonyl oxygen coordination with Cs+ in the Δ13-PcTx1 structure. See also Figure S2.
Figure 3
Figure 3
Transmembrane domain swap mediated by the ‘GAS’ belt. (A) Cartoon representation of Δ13 transmembrane domains. One subunit is red and the region above and below the ‘GAS’ belt is labeled as ‘TM2a’ and ‘TM2b,’ respectively. (B) Fo-Fc ‘omit’ map generated with a model lacking residues Ile 442 to Leu 450 contoured at 3.0 σ. The Δ13 is shown as an α-carbon trace with one subunit omitted for clarity. (C) View of the transmembrane domain from the intracellular side and shown in cartoon representation. Residues near or in the ‘GAS’ belt are shown as sticks. (D) Close-up view of the boxed region in (C) illustrating how the hydroxyl group of Ser 445 caps the TM2a helix of an adjacent subunit.
Figure 4
Figure 4
Gating movements in the extracellular and transmembrane domains deduced from comparison of the desensitized state and MitTx-bound structures. Cartoon representation of the desensitized state (A) and the Δ13-MitTx state (B) where the structurally conserved scaffold is blue, the malleable lower palm domain is yellow, and the transmembrane domains are red. Measurements use the Cα atoms Ala 424 on adjacent subunits as landmarks. (C) View of the transmembrane domains from the extracellular side illustrates the iris-like rotation of TM1 and TM2a. TM1 and TM2a are in cylinders and ribbon representation, respectively. In panels C-F the desensitized and Δ13-MitTx structures are gray and red, respectively. (D) View of the transmembrane domains from the intracellular side shows that TM2a rotates by ~44°, in the plane of the membrane. (E) View of the transmembrane domains perpendicular to the bilayer illustrating tilts of ~10° and ~4° by TM1 and TM2, respectively. (F) Close-up view of the transmembrane helices of one subunit. The TM1 domain of the Δ13-MitTx structure is superimposed onto the TM1 domain of the desensitized state structures using Cα positions of residues Cys 50 to Phe 70. Both TM1 and TM2 are shown in ribbon representations. See also Figure S3.
Figure 5
Figure 5
The Δ13-MitTx complex harbors an open pore with a constriction located below the gate near the ‘GAS’ belt. (A) A section of an electrostatic potential of Δ13. Pore-lining surface down the threefold axis of the Δ13-MitTx (B) and the desensitized state structures (C). The plots in (B) and (C) were generated using the HOLE software (pore radius: red < 1.15 Å < green < 2.3 Å < purple). (D) Plot of radius as a function of longitudinal distance along the pore for Δ13-MitTx (red), Δ13-MitTx (amiloride, green), desensitized state (black), Δ13-PcTx1 (high pH, dark blue), and Δ13-PcTx1 (low pH, light blue). (E) Close-up view of the pore domain. Only one TM2 domain is shown for clarity and is in ribbon representation. Residues lining the pore are shown as sticks.
Figure 6
Figure 6
Selectivity and structure of the ‘GAS’ selectivity filter. Whole cell, patch-clamp current/voltage analysis of the Δ13-MitTx complex in the presence of alkali metal cations (A) or organic cations (B). (C) Close-up view of the ‘GAS’ belt. Glycine residues 436 and 439, and residues in the ‘GAS’ belt are shown as sticks. One subunit has been omitted for clarity. A 2Fo-Fc map contoured at 1.5 σ illustrates the monovalent Cs+ site in the ‘GAS’ belt. This peak overlaps with an electron density peak calculated using anomalous difference amplitudes as coefficients. (D) Schematic illustration showing how the conductive pore is lined with carbonyl oxygens. (E) View of the ‘GAS’ belt from the intracellular side, perpendicular to the membrane plane, from the Cs+ soaked crystals, showing the 2 Fo-Fc peak for Cs+ and distances between the Gly 443 (7.1 Å) and Gly 439 (6.6 Å) carbonyl oxygen atoms. (F) Same view as in (E) of the ‘GAS’ belt derived from the Δ13-MitTx complex in the presence of Na+, showing how the size of the selectivity contracts in the presence of Na+, as measured by the distance between Gly 443 carbonyl oxygen atoms (6.2 Å). See also Table S2.
Figure 7
Figure 7
Fenestrations allow cations and amiloride access to the pore. (A) View of Δ13-MitTx complex bound to amiloride or Cs+. The structures of the amiloride-soaked and the Cs+ soaked Δ13 were superimposed. One fenestration is highlighted by a solid teal line, Cs+ and amiloride are in sphere and sticks representation, respectively. Δ13 is shown in both surface (gray) and ribbon representation and colored as in Figure 1A. (B) Close-up view of the fenestration. Residues near the Cs+ sites and amiloride are in sticks representation. Dashed lines indicate that interactions are mediated by water. (C) View of Cs+ and amiloride sites from the extracellular side showing how the two types of sites are near one another. The anomalous difference map showing Cs+ sites is contoured at 3.0 σ and shows one strong Cs+ site (5.0 σ) above amiloride and a weaker site (3.7 σ) near the guanidine group of amiloride. See also Figure S4.

References

    1. Adams CM, Snyder PM, Welsh MJ. Paradoxical stimulation of a DEG/ENaC channel by amiloride. J Biol Chem. 1999;274:15500–15504. - PubMed
    1. Adams PD, Grosse-Kunstleve RW, Hung LW, Ioerger TR, McCoy AJ, Moriarty NW, Read RJ, Sacchettini JC, Sauter NK, Terwilliger TC. PHENIX: building new software for automated crystallographic structure determination. Acta Crystallogr D Biol Crystallogr. 2002;58:1948–1954. - PubMed
    1. Alvarez de la Rosa D, Zhang P, Shao D, White F, Canessa CM. Functional implications of the localization and activity of acid-sensing channels in rat peripheral nervous system. Proc Natl Acad Sci USA. 2002;99:2326–2331. - PMC - PubMed
    1. Baconguis I, Gouaux E. Structural plasticity and dynamic selectivity of acid- sensing ion channel-spider toxin complexes. Nature. 2012;489:400–405. - PMC - PubMed
    1. Baconguis I, Hattori M, Gouaux E. Unanticipated parallels in architecture and mechanism between ATP-gated P2X receptors and acid sensing ion channels. Curr Opin Struct Biol. 2013 doi: 10.1016. - PMC - PubMed

Publication types